Educ 206: Data Visualization For All
Fall 2022 Syllabus
Our course meets in-person, wearing face masks in compliance with the campus Covid policy, on Tuesdays & Thursdays 1:30-2:45pm in Seabury S205 at Trinity College, Hartford.
Instructors
Professor Jack Dougherty, Trinity College, Hartford CT. Email me a quick question or schedule a Zoom appointment on my calendar.
Teaching Assistant Victoria Asfalg ‘23
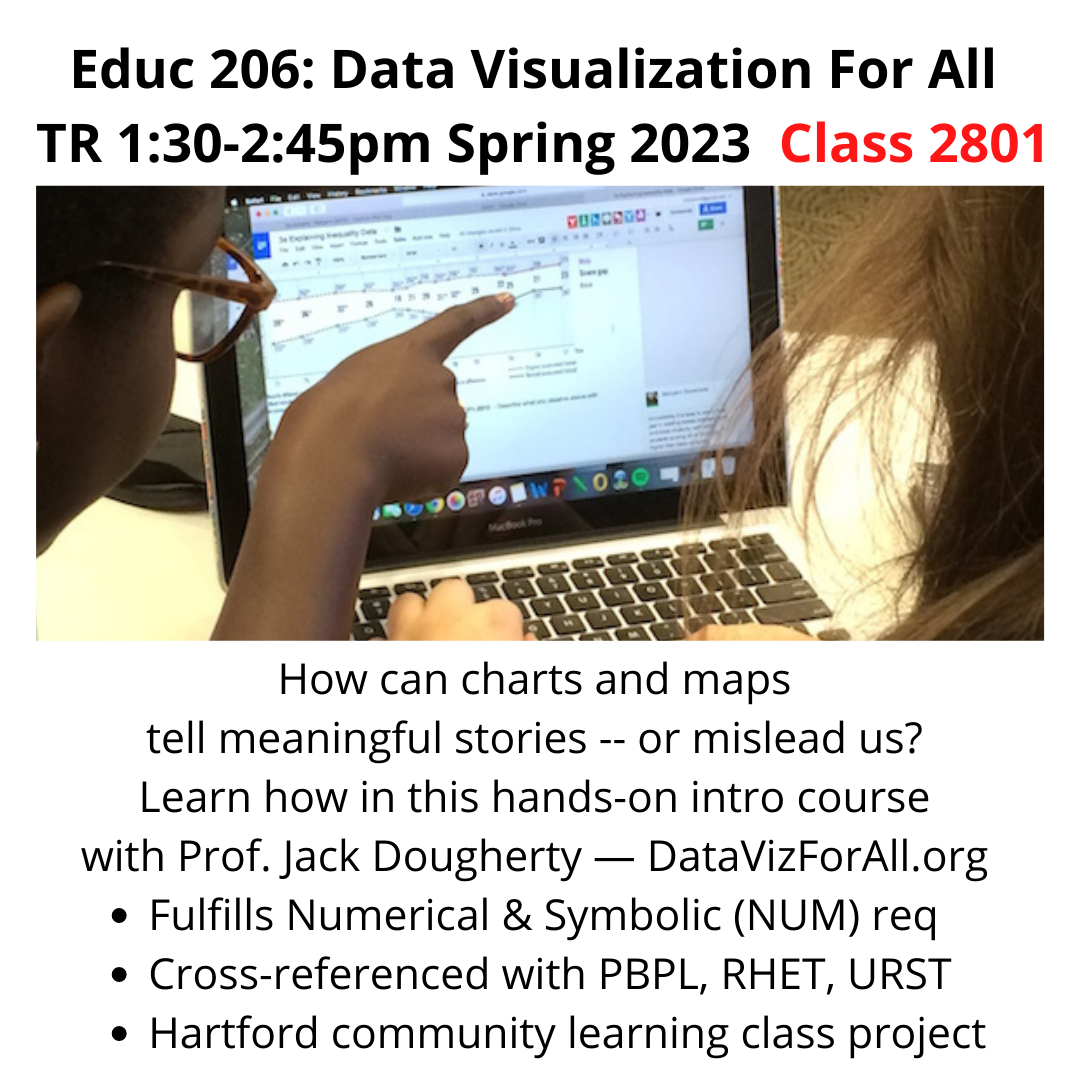
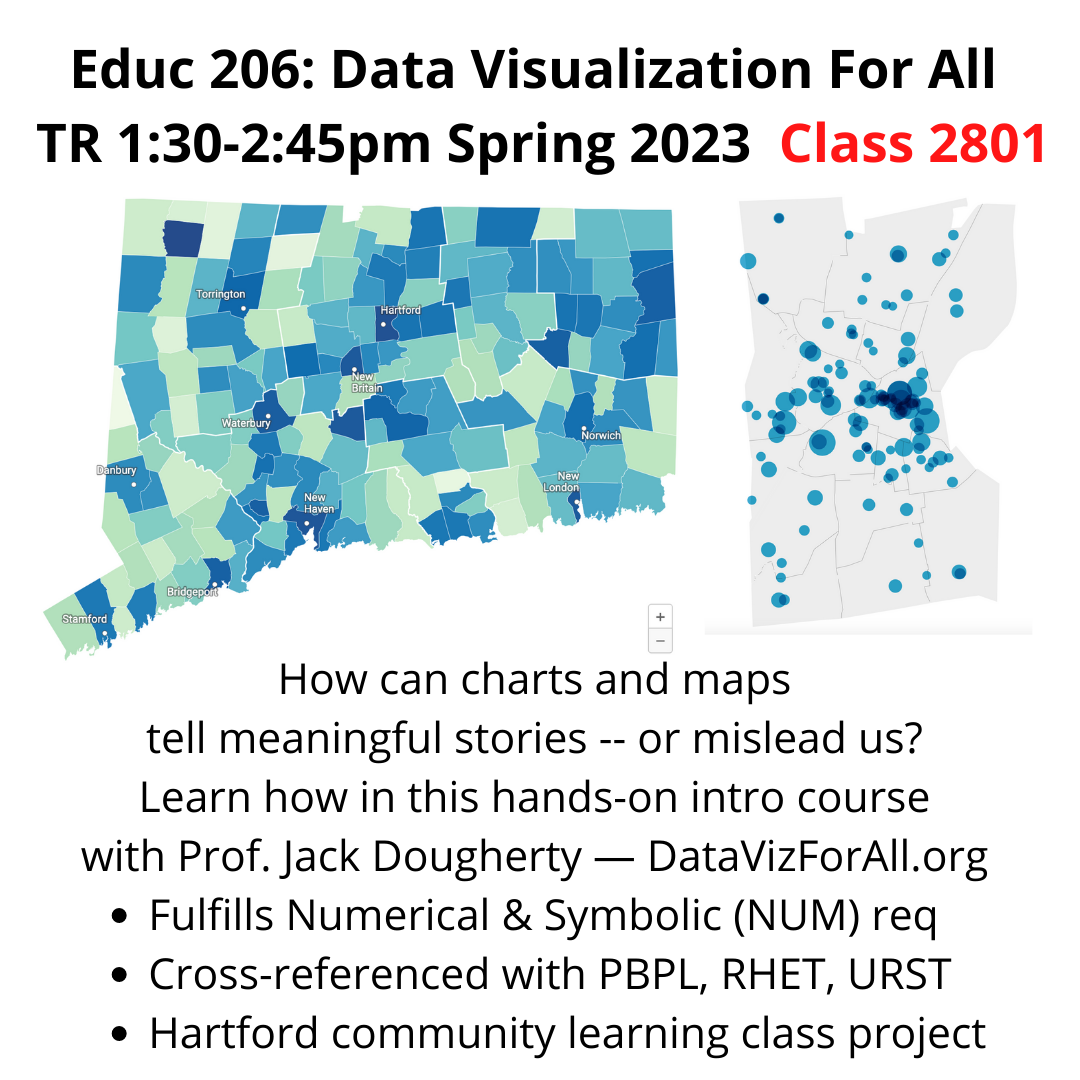
Course description: How can charts and maps tell meaningful stories? How can they mislead us from the truth? In this introductory hands-on course, we will create data visualizations in order to better understand design principles and develop a critical analysis of the field. Students will learn skills in both quantitative reasoning and digital storytelling as we advance from beginner tools to editing code templates. For the community learning component, our class will build interactive charts and maps on a public policy issue with a Hartford-area partner organization. No coding experience is necessary, but curiosity is required.
- Fulfills Numerical and Symbolic Reasoning (NUM) requirement.
- Cross-referenced with Community Learning, Public Policy & Law, Writing & Rhetoric, Urban Studies.
- Enrollment limited to 19 students.
Community Learning Partner
Our partners at the Center for Leadership and Justice asked us to work with them to analyze and visualize data on education funding inequities in the metro Hartford region.
Intro video for Fall 2022 students with Center for Leadership and Justice partners: Marika Stewart, Jocelyn Gardner Spencer, Sarah McCoy
Course Materials and Tools
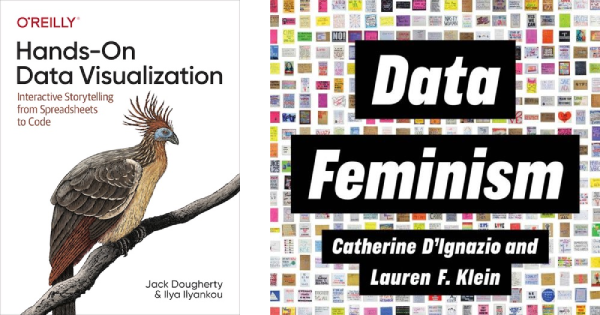
- Two open-access books are freely available online (or you can purchase print editions).
- Jack Dougherty and Ilya Ilyankou, Hands-On Data Visualization: Interactive Storytelling from Spreadsheets to Code (O’Reilly Media, Inc., 2021), https://HandsOnDataViz.org.
- Catherine D’Ignazio and Lauren F. Klein, Data Feminism (MIT Press, 2020), https://data-feminism.mitpress.mit.edu.
- Bring a laptop computer (Mac, Windows, or Chromebook) to every class. Install more than one browser (such as Firefox, Safari, Chrome) for testing purposes. Tell me if you need a temporary laptop loaner.
- You will need to sign up for several free web services (such as Google Drive, Datawrapper, GitHub). See my list of recommended free digital tools in this course.
Learning Goals and Assessments
In this course you will demonstrate the knowledge and skills you have developed to meet 12 broad learning goals (with more specific sub-goals listed in the schedule further below):
- Strengthen Your Spreadsheet Skills
- Find and Question Your Data
- Clean Up Messy Data
- Make Meaningful Comparisons
- Chart Your Data
- Map Your Data
- Transform Your Map Data
- Edit and Host Leaflet Code on GitHub
- Explore Leaflet Map Code Templates
- Detect Lies and Reduce Bias
- Tell and Show Your Data Story
- Embed on the Web
Your progress toward these learning goals will be assessed in three ways:
A. Open-Book Weekly Quizzes
- The purpose is to demonstrate your knowledge and skills through questions that emphasize conceptual understanding and how to apply it in new contexts. You will have more than one opportunity to successfully complete each quiz while working independently with your notes, readings, and any web resources.
- Each week, select any 2-hour period during the 3-day window (typically from Friday afternoon to Monday 9pm) to complete a Moodle quiz of around 5 questions on the designated learning goal. You may see different versions of questions than other students, but all questions address the same goal.
- Students have at least two attempts on every quiz. Short-answer questions will be scored automatically by the computer, and show-your-work questions will be scored manually by the instructor. If you respond incorrectly to an auto-scored question, the quiz will offer advice and allow you to try again. If you respond incorrectly to a manually-scored question, the instructor will offer advice via email or a meeting and allow you to try again within 24 hours.
- Before you start the quiz, prepare by reading assigned chapters, doing practice exercises, and discussing the material with classmates who have not yet started it.
- When you start the 2-hour quiz period, you may use your materials (including your notes, the online book, and the entire Internet), but you must work independently and you may not communicate about the quiz content in any way (except with the instructors) until the quiz has closed. You are responsible for following the Intellectual Honesty policy as described in the Trinity Student Handbook. If doubts arise, the instructor may require you to retake a quiz under direct supervision and/or refer the issue to the Honor Council.
- If you do not begin a quiz or demonstrate sufficient effort during the initial quiz window, a 20 percent late penalty will be deducted for every 12-hour period beyond the deadline. Exceptions are granted only for documented health or family emergencies.
- 12 broad learning goals x 5 points per quiz = 60 points
B. Building Data Stories
- The purpose is to show your work in building different stages of data visualizations and written narratives that explain why and how it matters to our community partners.
- Depending on the stage of the build, your work will be evaluated by the instructor, your peers, or guest experts, based on a rubric.
- 7 stages x 5 points = 35 points. A 20 percent late penalty will be deducted for every 12-hour period beyond the deadline. Exceptions are granted only for documented health or family emergencies.
C. Class Participation
- The purpose is to encourage active learning and accountability. Each student begins the course with 5 participation points. During class, you may be randomly called on to discuss a concept in our reading, or to share your computer screen for everyone to view while we learn tools and build data stories. You do not necessarily need to know the correct answer. But if you are not present or not able to participate when called, a point will be deducted from your participation score. Exceptions are granted only for documented health or family emergencies, or scheduling conflicts where you have notified me well in advance.
If you are quarantined or isolated due to Covid, or if you have concerns about your health, contact me in advance to request permission to participate remotely via Zoom during a specific class session. Last-minute requests may not be granted permission.
Summary
60 points quizzes + 35 points data stories + 5 class participation = 100 total points. In this course, unsatisfactory work (below 70%) falls in the D or F range, adequate work (70-79%) in the C range, good work (80-89%) in the B range, and outstanding work (90 to 100%) in the A range. Each range is divided into equal thirds for minus (-), regular, and plus (+) letter grades. For example, 80 to 83.33% = B-, 83.34 to 86.67 = B, and 86.68 to 89.99 = B+. Access your individual assessments on the password-protected Moodle site for this course at https://moodle.trincoll.edu.
Academic accommodations: please notify me before our third class session, and schedule an appointment on my calendar to discuss how we will implement your approved plan. For those students with accommodations approved after the start of the semester, a minimum of 10 days’ notice is required. Learn more at the Student Accessibility Resource Center.
Religious observances or other advance scheduling conflicts: please notify me before our third class session to request accommodations. Do not ask me to address last-minute requests.
How to Succeed in this Course
- Bookmark this online syllabus and check it for important updates, which will appear in bold.
- Keep a calendar (paper or digital) to manage your time and meet deadlines.
- Bring a laptop (with a fully-charged battery) to every class, and turn off distractions to help you (and others) focus on learning. Set notifications on digital devices to “Do Not Disturb.”
- Use a password manager to keep track of your digital accounts. See my introduction to Bitwarden, an open-source password manager with free core features for Windows/Mac/Linux computers, all major web browsers, and iOS and Android mobile devices.
- Take initiative and ask questions: during or after class, via email, or by appointment on my calendar. If you don’t understand something, other students probably are puzzled, too. Go ahead and ask.
- Meet up with other students outside of class. Create a small study group to review the course material and work together. The secret to success in college is teaching yourselves how to learn new material.
- If anything is interfering with your learning, email or talk with us about it. We care about how you’re doing in life, not just in our classroom.
Schedule
Important updates from the instructor will be marked in bold.
Tue 6 Sept
- Bring a mask to wear in our classroom (extras will be available), and bring a laptop computer (or use a desktop in the classroom).
- Introductions
- Overview of the syllabus, past projects, and our Hartford community-learning partner, the Center for Leadership and Justice https://cljct.org
- Advice from TA Victoria Asfalg about how to succeed in this course
- Sample quiz about syllabus for 1-point bonus, due in class on Moodle
- Why data visualization matters in the “disinformation age”. See Hands-On DataViz (HODV), Chapter 1 https://handsondataviz.org/introduction.html
- What sparks your interest in this course? Anonymous free-write on shared Google Doc
- Why data visualization matters to me: Telling and showing hidden stories of inequality in On The Line book-in-progress
Thu 8 Sept
- Overview of Learning Goal #1: Strengthen Your Spreadsheet Skills. Start reading and doing sample exercises in HODV Chapter 2 https://handsondataviz.org/spreadsheet.html
- Copy, Share, and Convert Google Sheets
- Geocode locations
- Sort and filter data
- Calculate with formulas
- Summarize with pivot tables
- Match columns with VLOOKUP
- Google Username and Sheet Sharing Practice
- Spreadsheet Skills Peer Practice
- Prep for Spreadsheet quiz, to be taken during any 2-hour period before Mon 12 Sept 9pm on Moodle
- How to meet with our TA or instructor to strengthen your skills
Tue 13 Sept
- Congratulations to all who successfully completed our first Moodle quiz. If you did not receive an email from me asking for revisions, then you likely earned full credit. Check your Moodle gradebook.
- Before class, read and be prepared to discuss Catherine D’Ignazio and Lauren Klein Data Feminism chapters 1 and 2 https://data-feminism.mitpress.mit.edu, especially these selections:
- Chapter 1. Power Chapter begins with a story about tennis star Serena Williams. What do the authors mean by this line? “What we choose to measure is a statement of what we value…and who we value”
- Chapter 2 about Challenge Power begins with a comparison of two different maps of Detroit. How do the maps differ, and what do the authors mean when they ask “Who makes maps and who gets mapped?”
- Overview of Learning Goal #2: Find and Question Your Data. Start reading HODV Chapter 3 at https://handsondataviz.org/find.html
- Challenge power & privilege in data
- Clarify levels of data
- Recognize public vs private data
- Mask or aggregate sensitive data
- Explore open data repositories
- Source your data
- Recognize bad data
- Question your data
- Prepare for Find and Question Data quiz, to be taken during any 2-hour period before Mon 19 Sept 9pm on Moodle
- Assign Build 0: Interview Community-Learning Partners to Clarify Research Questions.
Thu 15 Sept
- Meet with Center for Leadership and Justice partners on Zoom, 1:45-2:30pm, and write clarifying suggestions/comments in our Build 0 Shared Google Document
- Assign Build Stage 1: Find and Question Data on Education Funding Inequities. Due Wed Sept 21 by 12 noon on the Build 1 Google Doc, worth 5 points.
Tue 20 Sept
- Overview of Learning Goal #3: Clean Up Messy Data. Start reading HODV Chapter 4 at https://handsondataviz.org/clean.html
- Smart Cleanup in Google Sheets
- Find and Replace with Blank
- Transpose Rows and Columns
- Split Data into Separate Columns
- Combine Data into One Column
- Peer Practice: Download and Clean Census/American Community Survey data from Social Explorer
- Prepare for Clean Up quiz, to be taken during any 2-hour period before Mon 26 Sept 9pm on Moodle
- Alternative Assignment #1: Tue 20 September 7-8:30pm on Zoom (request link from instructor ahead of time). GHIAA All-Teams Meeting (Gun Violence, Housing, Mental Health, Environmental Racism, Education) to discuss strategy for October Research Actions. All GHIAA Issue teams will be coming together to increase our relational power through individual meetings, briefly share updates about the current status and development, and training that is relevant to the development of leaders across all issue teams. Then Issue Teams will hold Breakout Room Meetings. Education will focus on processing individual meetings and research action outlines as a group. See Alternative Assignment Guidelines further below.
Thu 22 Sept
- Review instructor’s post-assignment notes and classmates findings in Build Stage 1: Find and Question Data on Education Funding Inequities. I have made a “frozen copy” of your Google Docs and Sheets to evaluate, and individual scores will appear on Moodle soon.
Tue 27 Sept
- Overview of Learning Goal #4: Make Meaningful Comparisons. Start reading HODV Chapter 5 at https://handsondataviz.org/comparisons.html
- Precisely describe comparisons: practice in this Google Sheet
- Normalize your data
- Beware of biased comparisons
- Prepare for Meaningful Comparisons quiz, to be taken during any 2-hour period before Friday 30 Sept 9pm (new date to avoid quiz during Trinity Days and scheduling two quizzes due on same day) on Moodle
- Update: Since we have two quizzes over the next seven days, I am delaying Build Stage 2: Clean Data and Find Meaningful Comparisons, and merging it into Build 3 as one 10-point assignment. This also gives me more time to reorganize our recommended datasets and research questions to match the needs of our community partner.
Thu 29 Sept
- Before class, create a free account on Datawrapper.
- Overview of Learning Goal #5: Chart Your Data. Start reading HODV Chapter 6 at https://handsondataviz.org/chart.html
- Chart types
- Chart design principles and rules
- Create bar/column, histogram, line, area charts
- Create annotated, range, scatter charts
- Prepare for Chart Your Data quiz, to be taken during any 3-hour period before Mon 3 Oct 9pm on Moodle. Plan ahead and budget your time because this quiz contains 5 show-your-work questions and may require more time than you have spent on prior quizzes.
Mon 3 Oct
- CLJ moved date of alternate assignment to Fri Oct 14th
Tue 4 Oct
- Assign Build 2+3: Find Meaningful Comparisons and Create Preliminary Charts in preparation for next meeting with CLJ partners, due Friday 7 Oct by 12 noon, worth 10 points.
Thu 6 Oct
- Workshop time in class for Build 2+3, due Friday 7 Oct by 12 noon.
- Be prepared to share your draft work for feedback from all.
- See hints from Jack and Victoria
- Review results from Chart Your Data quiz
Tue 11 Oct
- No class: Trinity Days
Wed 12 Oct
- Alternative Assignment #2A: 6:15-7:30pm GHIAA Education Team Training with Erika Haynes from CT School + State Finance Project, in-person at Immanuel Congregational Church, 10 Woodland St (across from Mark Twain House) in their Fellowship Hall with free refreshments. See my email to register in advance. Email me to request reimbursement for your transportation (with receipt) if needed. I also will attend. See Alternative Assignment guidelines further below.
Thu 13 Oct
- Review our progress report on Build 2+3 during 1:45-2:30pm Zoom meeting with Center for Leadership and Justice community partners.
- Be prepared to show and discuss how you created works shown in the progress report, and write notes on feedback from partners.
Fri 14 Oct
- Alternative Assignment #2B: 12-1pm Education Team Training with Erika Haynes from CT School + State Finance Project on Zoom. See my email to register in advance for the Zoom link. I also will attend. Download Powerpoint presentation slides.
- Alternative Assignment guidelines: Each student may attend one of the 60-90 minute online meetings with our community partners listed above and email me at least 250 words of insightful notes and/or personal reflections within 48 hours, to substitute for the Leaflet Map Code Template quiz that is due on Monday 7 November.
Tue 18 Oct
- Announcements: Alternative Assignment updates; almost finished with Build 2+3 evaluations.
- Overview of Learning Goal #6: Map Your Data. Start reading HODV chapter https://handsondataviz.org/map.html
- Map types (focus on point, symbol point, and choropleth maps)
- Map design principles and rules
- Choropleth colors and intervals (focus on basic concepts for now)
- Normalize choropleth map data
- Create choropleth maps with Datawrapper
- Prep for Map Your Data quiz, to be taken during any 3-hour period by Mon 24 Oct 9pm on Moodle.
Thu 20 Oct
- Continue overview of Learning Goal #6: Map Your Data,
- In-class duo practice exercises
- Use Interdistrict Choice Schools data to create a map of their locations, type, and enrollment size
- Use CT Town race & ethnicity ACS 2016-20 data to create a meaningful map of proportion of one racial or ethnic group
Sat 22 Oct
- Alternative Assignment #3: 2nd Annual RSCO School Choice Fun Fall Fair, Location: Dunkin Donuts Park, 1214 Main Street, near downtown Hartford, on Saturday, October 22, 2022. Time: 9:30 am to 1:30 pm. Attend ANY portion for 1 hour, visit school booths, and email me at least 250-word observational notes about how different magnet schools market themselves to interested families, plus a selfie photo on location, within 48 hours of the event, to substitute for the Leaflet Map Code Template quiz that is due on Monday 7 November.
Tue 25 Oct
- Good job on the Map quiz (and my apologies for forgetting to delete old content in bottom half of question 2)
- Reflection on RSCO school choice fair
- Overview of Learning Goal #7: Transform Your Map Data. Start reading HODV Chapter 13 https://handsondataviz.org/transform.html
- What’s a GeoJSON file and why does it matter?
- View and edit GeoJSON boundary data with either tool: GeoJSON.io or Mapshaper.org
- Updated steps to edit a CT Towns GeoJSON file and upload as a custom map boundary Datawrapper
- Open the ct-boundaries folder on GitHub in your browser, click Code > Download Zip, then uncompress the folder in your local computer. Be sure to use the updated 2022 file for next steps.
- Drag and drop the
ct-towns-2022-simple-datactgov.geojsonfile from your local computer to either Geojson.io or Mapshaper.org to edit - Edit a customized subgroup of CT towns, such as those shown in our 33-town Hartford region.
- Export your customized file, and rename if needed, with
.geojsonextension - When making a choropleth map in Datawrapper, upload your custom GeoJSON boundary file
- Prep for Transform Your Map Data quiz, to be taken during any 3-hour period by Mon 31 Oct 9pm on Moodle. If you celebrate Halloween, manage your time to finish the quiz well before the deadline.
Wed 26 Oct
- Alternative Assignment #4: Wed 26 October 6:30-8:00pm on Zoom (request link from instructor ahead of time). GHIAA All-Teams Meeting for October Research Actions. The Focus of the October All Teams Meeting and the Education Team Breakout determined closer to the date and designed based on the emerging issue.
- See also Alternative Assignment guidelines
Thu 27 Oct
- Before class, read Build 4 Draft, especially part B about school funding questions and sources. Explore at least 3 of the existing visualizations created by CT School + State Finance Project.
- In class: each student will be assigned to either summarize a portion of work we’ve done so far (Part A) OR ask question and take detailed notes about school funding data availability (Part B).
- Workshop with Erika Haynes and Morgan Considine, School + State Finance Project https://schoolstatefinance.org on Zoom from 1:45-2:30pm
- Fixed (see 25 Oct): Process to customize and upload 33-town GeoJSON boundary map to Datawrapper
- For next class: create a free account on Github. Use a relatively short or simple username that you may wish to share professionally in the future. In other words, “jackdougherty” or “jdougherty” is better than “BikeDaddy1965”.
Tue 1 Nov
- Overview of Learning Goal #8: Edit and Host Leaflet Code on GitHub. Start reading HODV Chapter 10 https://handsondataviz.org/github.html
- Analogy: GitHub Code Repository and Public Recipe Cookbook
- Example: https://github.com/JackDougherty/pumpkin-choc-chip
- Copy, Edit, and Host a Simple Leaflet Map
- Prep for Leaflet Code Editing quiz, to be taken during any 2-hour period by Mon 7 Nov 9pm on Moodle. This quiz is open now, and I recommend that you complete it as soon as possible since most students have two quizzes due on Nov 7th.
- Help me reach students who may be interested in Educ 206 DataViz in Spr 2023, TR 1:30-2:45pm
Thu 3 Nov
- Overview of Learning Goal #9: Explore Leaflet Map Code Templates. Start reading HODV Chapter 12 https://handsondataviz.org/leaflet.html
- Leaflet Storymaps with Google Sheets
- Leaflet Maps with Google Sheets
- Prep for Leaflet Map Code Template quiz, to be taken during any 2-hour period by Mon 7 Nov 9pm, meaning two quizzes due on the same date for most students, on Moodle.
- Alternative Assignment guidelines: Each student may attend one of the 60-90 minute online meetings with our community partners listed above and email me at least 250 words of insightful notes and/or personal reflections within 48 hours, to substitute for the Leaflet Map Code Template quiz #9 that is due on Monday 7 November.
Tue 8 Nov
- Today is US Election Day: Is our topic just a coincidence?
- Compare how two different maps forecast results of US House of Representatives results for today’s election. What do you notice?
- Overview of Learning Goal #10: Detect Lies and Reduce Bias. Start reading HODV Chapter 14 https://handsondataviz.org/detect.html
- How to Lie with Charts
- How to Lie with Maps
- Recognize and Reduce Data Bias
- Recognize and Reduce Spatial Bias
- Prep for Detect Lies quiz, to be taken during any 3-hour period by Fri 11 Nov 9pm on Moodle. We have an early quiz deadline this week to provide you with sufficient time for Build #4 next week.
- Assign Build 4 combined with Quiz #11: Tell a Meaningful Data Story with around 750-1000 words and at least two visualizations. Work solo (may be coordinated) or as a duo. Due Mon 14 Nov 9pm, with link on the Build 4 Doc to work in your Google Doc, worth 10 points.
Thu 10 Nov
- Confirm student assignments for Build 4 combined with Quiz #11
- Due Mon 14 Nov 9pm
- Overview of Learning Goal #11: Tell and Show Your Data Story. Start reading HODV Chapter https://handsondataviz.org/story.html
- Build Narrative on a Storyboard
- Draw Attention to Meaning
- Acknowledge Sources and Uncertainty
- There is no separate Moodle quiz, because this content is combined with Build 4 above.
- Workshop: Draw your data story ideas, on paper
Tue 15 Nov
- Looking ahead to Finalizing Your Data Stories
- Sample data story 1 by Victoria Asfalg and Riley Nichols, December 2021
- Sample data story 2 by Bonnie LaBonte and Lachlan Clark, December 2021
- Assign Build Stage 5: Peer Review Template for Data Story, due during class, worth 5 points. Choose to either type comments into a shared Google Doc or hand-write on paper. Share copy with instructor who will evaluate the quality of constructive feedback.
- See peer review assignments on Build 4 document. Students must submit a full draft for review before they can participate in peer review.
- Announcement about scoring of combined assignment: Build 4 (5 points based on work submitted before Tuesday’s class) and Quiz 11 (5 points based on revised work submitted before Thursday’s class). Continue to use same links on Build 4 document.
- Need your help to recruit students for next semester
Thu 17 Nov
- Overview of Learning Goal #12: Embed on the Web. Start reading Chapter 9 https://handsondataviz.org/embed.html
- Static images versus interactive iframes
- Get the iframe embed code for a published visualization
- Embed the iframe code in an HTML web page
- Make your own copy of dataviz-story-template from GitHub and follow instructions inside the
index.htmlfile - Start Embed on the Web quiz, due by Tues 22 Nov 2:45pm on Moodle.
- Assign Build Stage 6: Submit complete draft of your data story, as a published GitHub Pages link, due at end of class on Tues 29 Nov, for comments by CLJ (no scores).
- Sign up for a 20-minute Zoom meeting on my calendar (with classmate if working together) to review instructor’s feedback on data story, required by Tues 22 Nov
Tue 22 Nov
- Scheduled Zoom meetings with instructor (Fri-Mon-Tues 18-21-22 Nov) instead of regular class to review my feedback on data stories.
Thu 24 Nov
- No class: Thanksgiving break
Tue 29 Nov
- Thank you for helping to recruit new students for next semester
- See updated dataviz-story-template section 3 for sample citation + bibliography, and helpful https://Zbib.org tool. Note that you may need to click the edit button to manually add key details such as author and date if the tool does not automatically recognize them from the web page you wish to cite.
- Workshop to finish data stories in preparation for CLJ meeting on Thur 1 Dec
- 5-minute meetings with instructor to review content or HTML formatting
- 5-minute meetings with TA to rehearse your 2-minute presentations of highlights in your data story on GitHub
- Everyone: Finish moving text and visualizations from Google Doc to GitHub format
- Everyone: Review Expectations and Assessment criteria in Build 6+7 Doc
- In Build 6 Google Doc paste your data story title (with link) and names before leaving class updated: by Wed 9am. I will reorganize the lineup to create a more coherent flow of topics for our audience.
Thu 1 Dec
- Meet with Center for Leadership and Justice partners on Zoom, 1:35-2:40pm
- Build 6: Deliver 2-minute presentation of highlights in your data story, then listen to feedback and write down revisions to consider. Comments only, not graded.
- Assign Build Stage 7: Revise and Finalize Data story on GitHub Pages template for guest experts, due Tues 6 Dec at 4pm. No extensions because your work must be “frozen” and forwarded to guest experts at this time. Worth 10 points, evaluated by guest experts.
- Students are welcome to schedule an appointment on my online calendar before Tuesday’s class.
- Invitation from CLJ to attend Greater Hartford Interfaith Action Alliance Social Justice Assembly, Wed Dec 7th from 7-9pm at Weaver High School Auditorium, 415 Granby St, Hartford. Register at http://cljct.org/special-guests. One of your classmates is offering to drive.
Tue 6 Dec
- In class: Student course feedback on what helped you learn. Also, please fill out the College’s standard online evaluation form when available.
- About Build 7: Present Final Data Stories to Guest Experts.
- Thursday’s presentations will begin at 1:15pm on Zoom. Log in a few minutes before your presentation time and hang out in the waiting room to be let in.
- After today’s class at 4pm (no extensions), your data story will be “frozen” and a copy will be transferred to our class GitHub account. I will forward this final version to our guest experts, who need to read your work before your presentations, and I will publish it on the public Partners and Projects page.
- Decision to make before your data story is “frozen” and published:
- Insert your full name (recommended), or you have the right to use only your first name or initials
- See what other students did in my “Public Writing and Student Privacy” chapter of Web Writing book (2015).
- Recommended: Insert link to your published data story in your resume to demonstrate what you learned to prospective employers and graduate schools.
- Keep in touch: See my Advising page on “How to request a reference or recommendation letter”
- Workshop: Last chance to consult with instructor, TA, and classmates to finalize data story.
Thu 8 Dec
- Class begins at 1:15pm today and will take place in my Zoom room to ensure time for all presenters to interact with guest experts. Students must log into my Zoom room a few minutes before their designated time.
- Build 7: Present Final Data Stories to Guest Experts: Shasha Davis and Michael Morton (both from https://schoolstatefinance.org) and Ilya Ilyankou (Trinity ‘18 and https://HandsOnDataViz.org co-author). Guest experts will review final data stories online before the event. Each solo/duo will up to 2 minutes to orally present highlights, then 4-5 minutes to respond to questions from evaluators about your data analysis, storytelling, and design decisions. Worth 10 points, scored by guest evaluators.