
Educ 206: Data Visualization For All
Fall 2025 Syllabus
Two sections of the course meet in person:
- Mondays and Wednesdays 10-11:15am in Seabury N215, School Finance Equity project (Educ 206-02, TCOnline code 3498)
- Mondays and Wednesdays 11:30-12:45pm in Seabury S205, School Based Health Centers project (Educ 206-01, TCOnline code 2281)
Contact me directly if PeopleSoft does not allow you to automatically enroll in your preferred section.
Instructors
- Professor Jack Dougherty, Trinity College, Hartford CT. Email me a quick question or schedule a Zoom appointment on my calendar.
- Teaching Assistant for both sections: Nellie Conklin ‘26 - office hours on most Thursdays, 3-5pm, at Peter B’s
- Research Assistant for school based health centers project: Alison MacDougall ‘26 - available in selected class sessions and by appointment
Course description: How can charts and maps tell meaningful stories? How can they mislead us from the truth? In this introductory hands-on course, we will create data visualizations in order to better understand design principles and develop a critical analysis of the field. Students will learn skills in both quantitative reasoning and digital storytelling as we advance from beginner tools to editing code templates. For the community learning component, our class will build interactive charts and maps on a public policy issue with a Hartford-area partner organization. No coding experience is necessary, but curiosity is required.
- Fulfills Numerical and Symbolic Reasoning (NUM) requirement.
- Fulfills Research Methods requirement for Ed Studies majors.
- Cross-referenced with Public Policy & Law (for empirical elective in the major, and education and urban policy concentrations), Urban Studies, Community Learning (for Community Action minor), Rhetoric and Writing.
- Enrollment limited to 19 students.
Community Learning Projects
Each section partners on a data project with a Hartford or CT organization:
MW 10:00 - School Finance Equity
Our partner is Melanie Strout (Community Engagement Manager) from the School + State Finance Project. We will create data stories to visualize answers to questions posed by the parter and also raised in a recent article by CT Insider journalists Alex Putterman and Natasha Sokoloff: How much do Connecticut public schools spend per student in comparison to other states? How does spending vary across Connecticut districts? How does spending vary by cost of living in other states? How does the source of spending (local, state, or federal funds) vary across CT districts and compare to other states? To what extent does school spending address varying student needs across CT districts? Also, Michael Morton (Deputy Executive Director) will serve a guest evaluator of our final projects.
Intro video for School + State Finance Project, Fall 2025
MW 11:30 - School Based Health Centers
Our partners are Melanie Wilde-Lane (Executive Director) and Isabel Gonillo (Program Assistant) from the Connecticut Association for School Based Health Centers, also known as CASBHC. Their nonprofit organization advocates for medical, dental, and mental health services that are provided in over 300 public schools across the state. They have asked us to create data stories to help them answer questions such as: How does access to these health centers vary by family income and school district funding? How does free preventive care improve long-term health outcomes and reduce government costs for emergency room visits? Also, our guest evaluator will be Victoria Asfalg, Trinity ‘23, Policy and Data Analyst at Open Communities Alliance, an Urban Studies major who previously served as a TA for this course.
Intro video for CT Association of School Based Health Centers project, Fall 2025
Course Materials and Tools
- Two open-access books are freely available online (or you can purchase print editions).
- Jack Dougherty and Ilya Ilyankou, Hands-On Data Visualization: Interactive Storytelling from Spreadsheets to Code (O’Reilly Media, Inc., 2021), https://HandsOnDataViz.org.
- Catherine D’Ignazio and Lauren F. Klein, Data Feminism (MIT Press, 2020), https://data-feminism.mitpress.mit.edu.
- Bring a laptop computer (Mac, Windows, or Chromebook) to every class. Install more than one browser (such as DuckDuckGo, Firefox, Safari, Chrome) for testing purposes. Tell me if you need a temporary laptop loaner.
- You will need to sign up for several free web services (such as Google Drive, Datawrapper, GitHub). See my list of recommended free digital tools in this course.
Learning Goals and Assessments
In this course you will demonstrate the knowledge and skills you have developed to meet 12 broad learning goals (with more specific sub-goals listed in the schedule further below):
- Strengthen Your Spreadsheet Skills
- Find and Question Your Data
- Clean Up Messy Data
- Make Meaningful Comparisons
- Chart Your Data
- Map Your Data
- Tables and Transform Data
- Edit and Host Leaflet Code on GitHub
- Tell and Show Your Data Story
- Detect Lies and Reduce Bias
- Try Advanced Map Templates
- Embed on the Web
Your progress toward these learning goals will be assessed in three ways:
A. Open-Book Weekly Quizzes
- The purpose is to demonstrate your knowledge and skills through questions that emphasize conceptual understanding and how to apply it in new contexts. You will have more than one opportunity to successfully complete each quiz while working independently with your notes, readings, and any web resources.
- Each week, select any 2-hour period during the quiz window (typically a four-day window from Wednesday afternoon to Sunday 9pm) to complete a Moodle quiz of around 5 questions on the designated learning goal. You may see different versions of questions than other students, but all questions address the same goal.
- Students can make at least two quiz attempts during the typical four-day window. Short-answer questions will be scored automatically by the computer, and show-your-work questions will be scored manually by the instructor. If you respond incorrectly to an auto-scored question, the quiz will offer advice and allow you to try again. If you respond incorrectly to a manually-scored question, the instructor will offer advice via email or a meeting and allow you to try again before the quiz window closes, if sufficient time remains.
- HINT: Start your quiz by Friday 12 noon if you want to receive the instructor’s feedback on show-your-work questions before the quiz window typically closes on Sunday 9pm. If you wait until the last minute and don’t start your quiz until Saturday or Sunday, you may not receive feedback from the instructor in time to do a second attempt.
- Before you start the quiz, prepare by reading assigned chapters, doing practice exercises, and discussing the material with classmates who have not yet started it.
- When you start the typical 2-hour quiz period, you may use your materials (including your notes, the online book, and any Internet content or tools), but you must work independently and you may not communicate about the quiz content in any way (except with the instructors) until the quiz has closed. See the Intellectual Honesty and Artificial Intelligence policy further below.
- If you do not begin a quiz or demonstrate sufficient effort during the quiz window, a 20 percent late penalty will be deducted for every 12-hour period beyond the deadline. Exceptions are granted only for documented health or family emergencies.
- 12 learning goals x 5 points per quiz (but no quiz for Goal #11) = 55 points
B. Building Data Stories
- The purpose is to show your original work in building different stages of data visualizations and written narratives that explain why and how it matters to our community partners. See the Intellectual Honesty and Artificial Intelligence policy further below.
- Depending on the stage of the build, your work will be evaluated by the instructor, your peers, or guest experts, based on a rubric.
- 8 stages x 5 points = 40 points. A 20 percent late penalty will be deducted for every 12-hour period beyond the deadline, with exceptions granted only for documented health or family emergencies.
C. Class Participation
- The purpose is to encourage active learning and accountability. Each student begins the course with 5 participation points. During class, you may be randomly called on to discuss a concept in our reading, or to share your computer screen for everyone to view while we learn tools and build data stories. You do not necessarily need to know the correct answer. But if you are not present or not able to participate when called, one point will be deducted each time from your participation score.
- Exceptions will be granted for any pre-scheduled absences (such as religious observations or any pre-planned events, if you email me at least one week ahead of time), or health or family emergencies (if you email me at least one hour before class). If you have health concerns that prevent you from attending class in person (such as Covid or other illness), email me at least one hour before class, and if feasible, request permission to participate remotely. Learning on Zoom is not as good as learning in real life, but it’s better than not attending at all. Last-minute requests will not be granted.
Summary
55 points quizzes + 40 points data stories + 5 class participation = 100 total points. In this course, unsatisfactory work (below 70%) falls in the D or F range, adequate work (70-79%) in the C range, good work (80-89%) in the B range, and outstanding work (90 to 100%) in the A range. Each range is divided into equal thirds for minus (-), regular, and plus (+) letter grades. For example, 80 to 83.33% = B-, 83.34 to 86.67 = B, and 86.68 to 89.99 = B+. Access your individual assessments on the password-protected Moodle site for this course at https://moodle.trincoll.edu.
Intellectual Honesty and Artificial Intelligence
- You are responsible for following the Intellectual Honesty policy as described in the Trinity Student Handbook.
- Artificial intelligence tools are not prohibited in this course, but think carefully before using any technology that might interfere with your learning. Large Language Models (LLMs), such as ChatGPT by OpenAI or Claude by Anthropic, can be helpful for repetitive tasks or proofreading paragraphs you’ve already composed. But LLMs only create plausible-sounding text based on statistical patterns in their training data, sometimes with invented facts and bad calculations. LLMs also raise ethical questions about unpaid labor, harmful biases, energy usage, and safety for humanity. Don’t cheat yourself out of an education by substituting LLM-generated responses in place of authentic learning.
- For online quizzes, you may use your materials (including your notes, the online book, and any Internet content or tools), but you must work independently and you may not communicate about the quiz content in any way (except with the instructors) until the quiz has closed. If any doubts arise, the instructor may require you to show your work, retake a quiz under direct supervision, or refer a case to the Honor Council.
- For build assignments, You (and your partner) are expected to create all original content (text and visualizations), with proper citations to any paraphrased or quoted text written by others, image credits to any visuals produced by others, and a methods section that describes all tools used and how. If any doubts arise, the instructor may require you to show your work, or independently reproduce content under direct supervision, or refer a case to the Honor Council.
Academic accommodations
Please notify me before our third class session, and schedule an appointment on my calendar to discuss how we will implement your approved plan. For those students with accommodations approved after the start of the semester, a minimum of 10 days’ notice is required. Learn more at the Student Accessibility Resource Center.
How to Succeed in this Course
- Bookmark this online syllabus and check it for important updates, which will appear in bold.
- Keep a calendar (paper or digital) to manage your time and meet deadlines.
- Bring a laptop (with a fully-charged battery) to every class, and turn off distractions to help you (and others) focus on learning. Set notifications on digital devices to “Do Not Disturb.”
- Use a password manager to keep track of your digital accounts. See my introduction to Bitwarden, an open-source password manager with free core features for Windows/Mac/Linux computers, all major web browsers, and iOS and Android mobile devices.
- Take initiative and ask questions: during or after class, via email, or by appointment on my calendar. If you don’t understand something, other students probably are puzzled, too. Go ahead and ask.
- Meet up with other students outside of class. Create a small study group to review the course material and work together. The secret to success in college is teaching yourselves how to learn new material.
- If anything is interfering with your learning, email or talk with me. I care about how you’re doing in life, not just in our classroom.
Schedule
- Both sections follow the same schedule, with exceptions marked for 10:00 vs 11:30
- Important updates from the instructor will be marked in bold.
Wed Sept 3
- Bring a laptop computer.
- If you are enrolled but do not attend our first class, the Registrar will be instructed to drop you from the roster.
- Foldable name cards: write your preferred first name on both sides, and on the inside, add a unique detail about yourself to help me remember your name. I will collect them at the end of each class.
- Overview of the syllabus, Hartford community-learning partners, and past projects
- Advice from TA on scheduling appointments and how to succeed in this course
- Sample quiz about syllabus for 1-point bonus, with open-note format, due in class on Moodle
- Fill out simple form to share the Google Drive username (aka Gmail address) that you will use for this course
- Presentation: Why data visualization matters in the “disinformation age”. See Hands-On DataViz (HODV), Chapter 1 https://handsondataviz.org/introduction.html
- In-class: What sparks your interest in this course? Anonymous free-write on shared Google Doc
- About me: How did I learn about data visualization? Telling and showing hidden stories of housing and education inequality in On The Line book-in-progress
- Strengthen your spreadsheet skills: Starting reading and working on sample exercises before our next class listed below.
Mon Sept 8
- Before class, fill out quick survey about prior experience and education, then view 3000+ results in public sample dataset
- Overview of Learning Goal #1: Strengthen Your Spreadsheet Skills, HODV Chapter 2 https://handsondataviz.org/spreadsheet.html
- Spreadsheet terms, tools, and data formats
- Download, Copy, Share, and Convert Google Sheets
- Geocode locations
- Sort and filter data
- Calculate with formulas
- Summarize with pivot tables
- Match columns with XLOOKUP
- Tip: Borrow or buy a $15 external mouse to right-click more easily on spreadsheets
- Prep for Spreadsheet quiz, to be taken during any 2-hour period before Sun 9pm on Moodle.
- Hint: Start your quiz by Fri 12 noon to ensure sufficient time for instructor feedback, as I might email you during the quiz window with advice on revising your quiz, but only if you start early! If you do not receive an email, check your Moodle gradebook to see if you earned full credit.
- If you have questions about this week’s quiz, see our TA or schedule an appointment on my online calendar
Wed Sept 10
- Before class, read background and be prepared to ask questions during today’s introductory Zoom meetings with community partners
- 10:00 section
- Guests on Zoom, 10:15-11am
- Melanie Strout, Community Engagement Manager, School+State Finance Project
- Alex Putterman and Natasha Sokoloff, journalists at CT Insider
- Read Build 0 questions and be prepared to discuss with guests
- Read the School+State Finance Project website, especially About page and Issues pages on Systemic Inequality and Spending
- Read Alex Putterman and Natasha Sokoloff, “Gov. Lamont says CT spends more on education than any other state. The reality is more complicated,” CT Insider, June 1, 2025, https://www.ctinsider.com/news/education/article/connecticut-education-funding-disparities-data-20349937.php OR Gift article OR static PDF on Moodle.
- 11:30 section
- Guests on Zoom, 11:45-12:30 (permission granted to record call)
- Melanie Wilde-Lane and Isabel Gonillo, CT Association of School Based Health Centers
- Alison MacDougall ‘26, Research Assistant and Community Learning Research Fellow
- Read Build 0 questions and be prepared to discuss with guests
- Read the CT Association of School Based Health Centers website, especially the About page and Mapping link
- Read the CT Dept of Public Health web page about School Based Health Centers, especially the SBHC Fact Sheet PDF at the top
- Confirm opt-in site visit in place of a quiz TBA this semester: MD Fox Elementary School school-based health center, Tuesday Sept 23rd common hour, meet 12:05pm at Mather Circle to walk with Jack to the school, visit from 12:30-1pm, then walk back to campus to arrive for 1:30pm classes.
- In-class for all:
- Prepare to ask questions and take notes while meeting with community-learning partners on Zoom
- Google Spreadsheet Skills Practice
- A very personal “visual”ization, and why to say “hi” when you see me around campus
- Open this week’s quiz on Moodle
Mon Sept 15
- Before class, read and be prepared to discuss Catherine D’Ignazio and Lauren Klein Data Feminism chapters 1 and 2 https://data-feminism.mitpress.mit.edu, especially these selections:
- Chapter 1. Power Chapter begins with a story about tennis star Serena Williams. What do the authors mean by this line? “What we choose to measure is a statement of what we value… and who we value”
- Chapter 2 about Challenge Power begins with a comparison of two different maps of Detroit. How do the maps differ, and what do the authors mean when they ask “Who makes maps and who gets mapped?”
- Overview of Learning Goal #2: Find and Question Your Data. Start reading HODV Chapter 3 at https://handsondataviz.org/find.html
- Challenge power & privilege in data
- Clarify levels of data (especially US Census data)
- Recognize public vs private data
- Mask or aggregate sensitive data
- Explore open data repositories
- Source your data
- Recognize bad data
- Question your data
- Prepare for Find and Question Data quiz, to be taken during any 2-hour period before Sun 9pm on Moodle
- Recommended for Ed Studies majors: Walk with me to the Welcome Back lunch, 12:45-1:30pm in McCook 201 conference room
Wed Sept 17
- Assign random pairs to Build 1: Find and Question Census and Education Data. Paste the link to your co-authored starter Google Doc on our Build 1 page and share it so that anyone can comment before you leave the room. Due on Sun Sept 21st at 9pm (same deadline as the quiz, so plan ahead), worth 5 points.
- How is US Census data “socially constructed”? See HODV chapter
- Open this week’s quiz on Moodle
- Recommended but optional: Sign up to walk to brief tour of MD Fox Elementary School on Tuesday Sept 23rd. Meet up 12:05pm outside Mather front entrance and return in time for 1:30pm classes. Participants will automatically receive full credit for Quiz #8 later this semester.
Mon Sept 22
- Update on MD Fox Elementary school based health center tour on Tuesday Sept 23rd 12:05pm meet outside Mather front doors. They request group be limited to 8 students, so I will offer a second school tour TBA
- Brief review of Build 1 with incomplete sample. Student work has been downloaded and individualized written feedback will be emailed soon.
- Overview of Learning Goal #3: Clean Up Messy Data. Start reading HODV Chapter 4 at https://handsondataviz.org/clean.html
- Smart Cleanup in Google Sheets
- Find and Replace with Blank
- Transpose Rows and Columns
- Split Data into Separate Columns
- Combine Data into One Column
- Extract Tables from PDFs (instructor demo)
- Prepare for Clean Up quiz, to be taken during any 2-hour period before Sun 9pm on Moodle
Wed Sept 24
- New optional opportunity: Sign up to walk to brief tour of Montessori Magnet School on Tuesday Sept 30th. Meet up 12:10pm outside Mather front entrance (rain or shine) and return in time for 1:30pm classes. Participants will automatically receive full credit for Quiz #8 later this semester.
- Assign random pairs to Build 2: Find, Question, and Clean Data. Write responses in your co-authored and publicly shared Google Document, and include the link to your co-authored and publicly shared Google Sheet. Due Sunday Sept 28th at 9pm (same time as quiz, so plan ahead), worth 5 points.
- Open this week’s quiz on Moodle
Mon Sept 29
- Last chance to sign up for tour of Montessori Magnet School on Tuesday Sept 30th, meet 12:10pm outside of Mather front door. See list of participants
- Brief review of Clean Quiz: Practice matching data for next quiz and read the XLOOKUP chapter
- Feedback on Build 2 will be delivered before Wednesday’s class
- Overview of Learning Goal #4: Make Meaningful Comparisons. Start reading HODV Chapter 5 at https://handsondataviz.org/comparisons.html
- The big question: “Compared to what?”
- Decipher common US phrases: “apples-to-apples comparison” and “don’t cherry-pick your data”
- Practice how to precisely describe comparisons in this Google Sheet
- Normalize your data
- Beware of biased comparisons
- Prepare for Meaningful Comparisons quiz, to be taken during any 2-hour period before Sun 9pm on Moodle
- Assign random groups to Build 3: Read and Write Thoughtful Questions for Community partners
- Build 3 for 10am
- Build 3 for 11:30am
- Write your questions as suggestions on the Google Doc, due at beginning of class on Wed Oct 1st, worth 5 points.
Wed Oct 1
- 10am section Build 3: Prepare to discuss your questions with Melanie Strout from School + State Finance Project on Zoom, 10:10-10:40am
- 11:30 section Build 3: Prepare to discuss selected questions with Melanie Wilde-Lane and Isabel Gonillo from CT Association of School Based Health Centers on Zoom, 11:40-12:10
- TA Nellie shares DataViz XLOOKUP Practice to help prepare for the quiz – insert formulas to match and fill all three empty columns on the first sheet, using data from other sheets
- Open this week’s Meaningful Comparisons quiz on Moodle
- Overview of Learning Goal #5: Chart Your Data. Start reading HODV Chapter 6 at https://handsondataviz.org/chart.html
- Chart types
- Chart design principles and rules
- Create bar/column, histogram, line, area charts
Mon Oct 6
- Before class, create a free account on Datawrapper.
- Review: Compare student strategies on Covid normalization question
- Continue overview of Learning Goal #5: Chart Your Data. Finish reading HODV Chapter 6 at https://handsondataviz.org/chart.html
- Create histograms in Google Charts
- Compare line and area charts in Google vs Datawrapper
- Create annotated, range, scatter charts in Datawrapper
- Hint: When publishing your visualization, always test if your work is visible to the public by pasting the link in a private incognito window in your browser, OR a second browser, without being logged into your tool account.
- Practice choosing the most appropriate chart type and design it
- Another practice chart type with hidden data cleaning
- Early start due to Trinity Days: Open this week’s Chart Your Data quiz, to be taken during any 3-hour period before Sunday 9pm on Moodle. Plan ahead and budget your time because it contains 5 show-your-work questions and may require more time than you have spent on prior quizzes. Start your quiz by Friday 12 noon if you wish to receive feedback for a second attempt. If you have questions, visit our TA’s office hours or schedule an appointment on my calendar.
Wed Oct 8
- Any questions about chart practice exercises above?
- Assign random pairs to Build 4 for 10am section and Build 4 for 11:30am section: Community Partner progress reports (TODO). Start link to your co-authored Google Sheet, set to anyone can comment, and insert on our Build doc. Due Sunday Oct 12th at 9pm, same deadline as the quiz, worth 5 points. Get an early start due to Trinity Days.
Mon Oct 13
- No class - Trinity Days
Wed Oct 15
- Prepare to Review and Discuss Progress Reports with Community Partners
- 10am Build 4: School+State Finance Project on Zoom, 10:15-11am
- 11:30 Build 4: CT Association of School Based Health Centers on Zoom, 11:45-12:30
- Build 4 was the last randomized-pair assignment. Start thinking about potential partners and topic preferences for final projects (Builds 5-8), which you will request soon. Working in duos is strongly encouraged and priority will be given to students who wish to partner with another student. No more than two students per team, but some research questions can be split for coordinated separate teams (working on related questions and data, but graded separately). While you can choose to work solo, you will be held to the same expectations as a duo.
- Brief review of Chart Quiz: Can you spot the problem?
- No Moodle quiz this weekend! Instead, schedule time with Nellie or me to strengthen your chart skills before we start map skills next week
Mon Oct 20
- Overview of Learning Goal #6: Map Your Data. Start reading HODV chapter https://handsondataviz.org/map.html
- Map types: locator point and symbol point (choropleth will be in the next class)
- Map design principles and rules
- Share links to your practice maps
Wed Oct 22
- Continue overview of Learning Goal #6: Map Your Data, https://handsondataviz.org/map.html
- Map type: choropleth (colored polygons)
- Map design: choropleth colors and intervals
- Normalize choropleth map data
- Practice creating meaningful choropleth maps and prep for the quiz:
- Go to Social Explorer on Trinity Library network and note that home page changed slightly
- Sidebar Menu > Data Library > ACS 5-year Estimates > Begin Report - see notes in Build 1 page 2
- Download any data for CT Towns (county subdivisions) and clean it - see notes in Build 2 page 2
- Connect your public Google Sheet to Datawrapper and select Connecticut Towns background map
- Explore ways to orient readers and draw their attention to meaningful patterns in map data
- Share links to your practice maps
- Prepare for 3-hour Map your Data quiz, due Sunday 9pm on Moodle. Start by Fri 12 noon to receive feedback in time for a second attempt.
- Open this week’s quiz on Moodle
Mon Oct 27
- Brief review of Map quiz (grading almost done and will be finished later today)
- Why is this a poorly-designed map?
- Best way to visualize the relationship between two data columns? How to interpret results?
- Best way to visualize Hartford-area magnet schools, with their enrollments and districts?
- Overview of Learning Goal #7: Tables and Transform Data
- Start reading HODV Chapter 8 https://handsondataviz.org/table.html
- Table Design principles
- Interactive table design in Datawrapper
- Practice creating an interactive table with selected magnet school data
- Start reading HODV Chapter 13 https://handsondataviz.org/transform.html
- What’s a GeoJSON file and why does it matter?
- Draw and export a simple GeoJSON boundary with GeoJSON.io
- Upload a simple GeoJSON boundary into a Datawrapper Locator map > Import line and area markers
- Download an existing GeoJSON boundary from https://geodata.ct.gov, such as CT Senate Districts 2025
- Upload your CT GeoJSON boundary to inspect features and edit in Mapshaper.org
- File > Download as CSV the first Google Sheet of selected magnet school data
- Simplify and rename your download to
magnets.csv - Upload your renamed CSV as a second layer in Mapshaper
- Question: Which points match which polygons? Answer: Join both layers in Mapshaper
- Open the Console command screen in Mapshaper
- Convert CSV layer to map points with command:
points x=Longitude y=Latitude - Ensure that points have proper map projection:
proj wgs84 - View both layers using dropdown menu > click eye for each layer
- Select
magnetslayer and type exactly:join CT_Senate_Districts fields="DistrictN" - Inspect your points. What new information does each contain?
- Export > select updated
magnetslayer > CSV, rename tomagnets-senate-districts.csv - Answer this question by creating a pivot table: How many magnet schools are located in each CT Senate District (aka DistrictN)? Hint: Total count of magnets in this sheet = 45
- Open the first of two quizzes this week, to be completed during any 2-hour period by Sun 9pm on Moodle.
- Start thinking about your preferences for final projects (Builds 5-8). Working in duos is strongly encouraged and priority will be given to students who wish to partner with another student. No more than two students per team, but some projects can be divided into coordinated separate teams (working on related questions and data, but graded separately). While you can choose to work solo, you will be held to the same expectations as a duo.
Wed Oct 29
- Before class: create a free account on Github. Use a relatively short or simple username that you may wish to share professionally in the future. Share your GitHub web address in this quick Google Form
- Overview of Learning Goal #8: Edit and Host Leaflet Code on GitHub. Start reading HODV Chapter 10 https://handsondataviz.org/github.html
- Analogy: GitHub Code Repository is like a public cookbook of recipes that you can modify, and GitHub Pages is like an oven that bakes your code into working public websites. See also Recipe for Jack’s Semi-Famous Pumpkin Chocolate Chip Cookies on GitHub
- Learn in class: Copy, Edit, and Host a Simple Leaflet Map
- Open the second of two quizzes this week, to be completed during any 2-hour period by Sun 9pm on Moodle. Reminder: students who participated in a school tour earlier this fall automatically receive full credit for quiz #8.
- Read updated list of research questions for Builds 5-8 and submit your preferred topics and partners in this Google Form before the end of the day. Priority will be given to students who choose to partner and list each other’s names, with final decisions made by the instructor to balance numbers.
Mon Nov 3
- Looking ahead at our remaining 5 weeks, and minor syllabus modifications
- View your assigned Research Questions for Builds 5-8, based on your preferences and my need to balance numbers
- What stands out when you skim a data story by a past student?
- Is Child Care Really Affordable in Connecticut Towns? by Josh Ruthfield and Nellie Conklin, last updated Feb 2024
- Crashes at Major Hartford Intersections in 2018-2022, by Jess Cruz and Mia Rodriguez, last updated April 2023
- Neighborhoods Where Hartford Habitat Has Built Homes And Why It Matters: Examining Opportunity and Income in Census Tracts by Victoria Asfalg and Riley Nichols, last updated Dec 2021
- Overview of Learning Goal #9: Tell and Show Your Data Story. Start reading HODV Chapter 15 https://handsondataviz.org/story.html
- Build Narrative on a Storyboard
- Draw Attention to Meaning
- Acknowledge Sources and Uncertainty
- What data storytelling methods does Rose Mintzer-Sweeney recommend in her Datawrapper: Fix My Chart posts?
- Assign Build 5: Plan and Sketch Your Data Story instead of a quiz for this learning goal. Before leaving the room, start your co-authored Google Doc, shared so that anyone can comment, and insert your link. Due by Sunday Nov 9th 9pm, worth 5 points.
Wed Nov 5
- Overview of Learning Goal #10: Detect Lies and Reduce Bias. Start reading HODV Chapter 14 https://handsondataviz.org/detect.html
- How to Lie with Charts
- How to Lie with Maps
- Recognize and Reduce Data Bias
- Recognize and Reduce Spatial Bias
- Open Detect quiz, to be completed during any 2-hour period by Sun 9pm on Moodle.
- Updated resources for Builds 5-8
- Overview of Learning Goal #11: Try Advanced Map Templates
- What do you notice about the map in this article? Sasha Allen, “What CT school districts would feel federal cuts the most?” CT Mirror, July 18, 2025, https://ctmirror.org/2025/07/18/ct-school-districts-education-funding-cuts/
- Try creating this 3-tab map of CT School Districts (Unified K-12, Elementary-only, Secondary-only) by Percent of Total Enrollment 24-25
- Learn the concept from Datawrapper: How to add tabs and drop-downs to your visualizations
- Use Pct of Total Enrollment data column in CT Public School DistrictType MapType 2025 sheet
- Create 3 separate choropleth maps > Connecticut > School Districts > Unified (2025), Elementary, Secondary
- Use the same scale (mine is 0 to 4%), then Publish and keep all three tabs open
- In the Datawrapper concept post (part 1.1), copy code for first 3 buttons, paste into Description for each map
- Paste the Publish > Visualization link from each map into the 1st map Description button code, modify text and button code labels, then paste identical versions into 2nd and 3rd map Descriptions
- Republish all 3 maps, then text the link to your 3-tab map into a new browser window
- Good news: There is no quiz for Advanced Map Templates, and everyone automatically receives full credit for trying it
Mon Nov 10
- for 11:30am section: Brief Zoom introduction with guest evaluator Victoria Asfalg, Trinity ‘23, former TA for DataViz class, currently Policy and Data Analyst at Open Communities Alliance
- see how she add links to her digital works in her 2023 PDF resumé, shared on Moodle
- Assign Build 6: Draft Your Data Story. Tell a meaningful data story on your assigned question, at least 750 words plus at least two visualizations, for review by peers and instructors. Before leaving the room, start your co-authored Google Doc, and include links to any of your public co-authored Google Sheets, plus static screenshots and links to any published visualizations. Insert your doc link for anyone to comment on our Build doc. Due by Sunday Nov 16th 9pm, worth 5 points.
- How and why to insert a static image or screenshot, and link to interactive version in your Google Doc
- Evaluation criteria for Builds 6-7 (plus one more for guest evaluators in Build 8):
- 1) How well does the data story answer the assigned question(s) and explain why it matters?
- 2) How well designed are the visualizations to draw true and meaningful insights from data?
- 3) How clearly does the story describe key steps in the process and cautions about data?
- 4) How challenging was it to create this data story based on existing sources and methods?
- Review your Build 5 plans, and advice for Build 6
- Keep Build 5 as-is (for Jack comments) and File > Make a Copy to start a clean Build 6
- Remember to address all parts of your assigned Research Question
- Divide your writing and visualizations into at least three sections – introduction, findings, sources & methods – and more creative subheadings are welcome
- Write your findings “based on the best available data,” and describe any issues or uncertainty in the sources and methods section
- School Based Health Center data updated Nov 9th and will be updated again soon
- Note that 4 schools with SBHCs are actually PreK school-readiness programs, with no CSDE Org codes to link to enrollments, etc. This means we can show 335 SBHCs, but only analyze demographics for 331 SBHCs
- Jack still finishing days & times, and cleaning up MH-M-D categories and DPH funding. But you can analyze and write “based on best available data” and insert the date of the most recent update
Wed Nov 12
- 10:15am start time for the School Finance Equity section today
- Workshop schedule for today
- In-class meetings with instructor for feedback on Build 5
- In-class meetings with TA/RA to prep for Build 6
- Work with your co-author during time between meetings
- 11:30am section: Start using SBHC “best available data” updated Nov 11th
- NEW CT EdSight school data downloads for student use - make sure to read the About page
- NEW Demo: Change #NA to blanks for pivot table calculations
Mon Nov 17
- Let’s support and coach each other to successfully complete our semester together
- In-class: Assign Peer Evaluation Guide of Build 6: Draft Data Stories for participation credit during class. Co-authors must have submitted a full draft in order to participate in the peer review.
- a) Write broad feedback on your guide and either paste the link in Build 6 or (if handwritten) ask instructor to scan & paste the link
- b) Write line-specific feedback as comments on original document
- Schedule a 20-minute Zoom appointment on my calendar for Thursday Nov 20th, Friday Nov 21st, or Monday Nov 24th. If working with a partner, both of you must attend the meeting at the same time to earn participation credit, so be sure to schedule the appointment together.
- Assign Build 7: Data Stories for Dress Rehearsal. Prepare your penultimate draft and rehearse your 2-minute presentation of highlights to classmates. Migrate all content from Google Doc to GitHub Pages format. Insert link to your published GitHub Pages template on our Build 7 doc. Due Tues Dec 2nd by 9pm (the second day back from Thanksgiving break), worth participation credit.
- Decisions to make before your data story is “frozen” in Build 8 and published on DataVizForAll:
- You can insert your full name (recommended), or you have the right to use only your first name or initials. Learn why in my chapter, “Public Writing and Student Privacy” in Web Writing book (2015).
- See what other students have done in prior Partners and Projects
- Recommended: Insert link to your published data story in your resume to demonstrate your skills and knowledge to prospective employers and graduate schools.
Wed Nov 19
- 10:15am start time for the School Finance Equity section today
- Overview of Learning Goal #12: Embed on the Web. Start reading Chapter 9 https://handsondataviz.org/embed.html
- Static images versus interactive iframes
- Get the iframe embed code for a published visualization
- Embed the iframe code in an HTML web page
- View online instructions for the DataViz Story Template, then make own copy of the GitHub code https://github.com/DataVizForAll/dataviz-story-template and practice editing
- Create an in-line citation (APA or MLA format) with the ZBib.org tool. Remember that you may need to manually edit to add key info that may be missing, such as author, title, date, website.
- Start Embed on the Web quiz, due by Sun 9pm on Moodle
Mon Nov 24
- In place of our regular class, scheduled 20-minute Zoom meetings by co-authors with instructor for Build 6 feedback. Both co-authors must attend for participation credit.
- Tips and resources to succeed on Build 7
- In your GitHub data story template, avoid deleting important HTML formatting like this common mistake
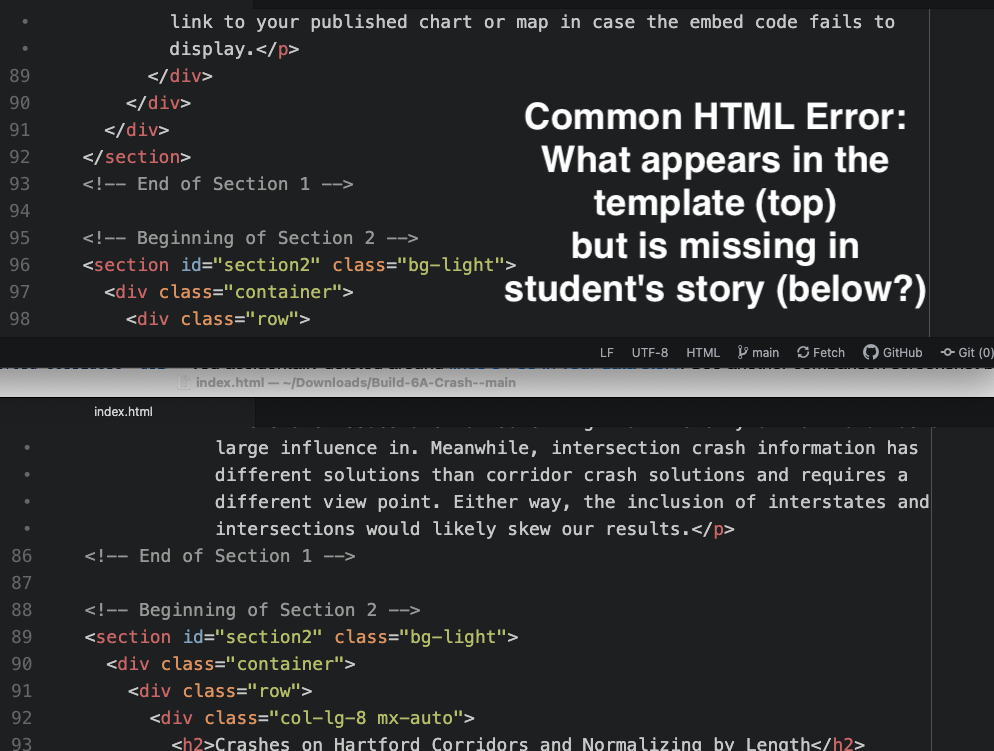
Wed Nov 26
- No class - Thanksgiving Break
Mon Dec 1
- Let’s support each other to cross the finish line together!
- Reminder: Build 7: Data Stories for Dress Rehearsal by Tues Dec 2nd at 9pm.
- Finalize all writing in your co-authored Google Doc and migrate all content to a GitHub Pages dataviz story template https://github.com/DataVizForAll/dataviz-story-template
- Only ONE co-author can create a GitHub repo, and only ONE can edit at a time. But you can grant editing access to your other co-author in Settings > Collaborators > Add People. Be careful not to overwrite each other’s changes! See screenshot in Section 4 of the dataviz story template web view.
- Avoid deleting important HTML formatting like this common mistake. If necessary, make a clean copy of the dataviz story template https://github.com/DataVizForAll/dataviz-story-template
- See also Section 4 Advanced Tips for a faster way to edit your GitHub file on your local computer and upload a new version online.
- Rehearse a 2-minute overview of highlights you plan to deliver to community partners and guest evaluators at our last class, worth participation credit.
- Suggestions for your 2-minute overview (and use your own creativity)
- QUICK introductions
- RESTATE the research question(s) you were assigned
- TELL us your key findings that answer the question(s)
- SHOW us supporting evidence in your most important visualizations
- EXPLAIN WHY it matters to our community partner
- Suggestions for your 2-minute overview (and use your own creativity)
- Assign Build 8: Final Data Story for Community Partners and Guest Experts. Finish any revisions to your published GitHub data stories by Thursday Dec 4th at 9pm. There are no extensions because guest experts need time to read your work. Early Friday AM, the instructor will make a “frozen” copy of your most current GitHub data story, republish it on the public Partners and Projects page, and paste the NEW links in Build 8 to send to our guest experts to read before your presentations. Worth 10 points, scored by community partners and guest experts.
- After this deadline, you are welcome to make further revisions to your version and email the instructor a request to “pull” your edits into the published version, but this might happen only after the guest evaluators have finished their work.
- Workshop time for the remainder of class, with opportunities to meet with instructor or TA
Wed Dec 3
- 10:15am start time for the School Finance Equity section today
- In-class: Build 7: Data Story Dress Rehearsal. Deliver 2-minute overview of highlights you will deliver to guest evaluators, and be prepared to respond to questions and feedback from our TA and classmates. Worth participation credit.
- Reminder Build 8: Revise and Finalize Data Story is due Thursday Dec 4th at 9pm, and will be “frozen” early Friday AM and published for guest evaluators to review.
- Fix Common Mistakes before the deadline for Build 8
- Avoid burying your main ideas. Instead, lift them up for readers to clearly see them in your introduction, and start body paragraphs with topic sentences to guide us.
- Avoid dropping your research question into the first sentence of your introduction. Instead, adopt the perspective of general readers, who are not yet familiar with the topic, and build the necessary context for us to understand what you are investigating.
- Avoid writing “…as shown in the table/chart/map ABOVE…” because that means you mistakenly reversed the recommended order. Instead, TELL us your insights then SHOW us your supporting evidence, and write it this way: “…as shown in table/chart/map/figure X BELOW…”
- Avoid poor design of visualizations. Instead, think carefully about principles of data visualization you have learned this semester. Draw attention to meaning with thoughtful use of titles, color, annotation, etc.
- Avoid naming “Jack Dougherty” as your source, since the true origin of all of our data are organizations such as CT Department of Education, CT Association for School Based Health Centers, etc. Instead, if you wish to acknowledge support from people who cleaned or downloaded data (such as Alison MacDougall and me) or who offered helpful feedback or examples (such as Nellie Conklin and me, or other students in class), then write acknowledgements in your sources & methods section.
- Avoid panic if your GitHub Pages revisions do not work right away. Instead, give the free system time to process your edits. Second, try making an edit somewhere else in the code. Finally, email me a description of the problem and include the link to your GitHub repo plus the line number.
- Appointments are available for Wednesday evening and Thursday mid-day on my online calendar. Or email me if you would like me to review anything in your data story.
- Keep in touch: See my Advising page on “How to request a reference or recommendation letter”
- Thank you for learning together during my last semester of 26 years of teaching at Trinity College!
- Sign up for Educ 200: Analyzing Schools in Spring 2026. Seats available in two sections: MW 8:30am or TR 9:25am

Mon Dec 8
- Build 8 Final presentations on Zoom with guest evaluators. Students only need to attend their assigned 10 minute time slot and must log into my Zoom room a few minutes before it begins. Guest evaluators will read final data stories online before the event. During your time slot, students will have up to 2 minutes to orally present highlights, then 4-5 minutes to respond to questions from evaluators about your data analysis, storytelling, and design decisions. Worth 10 points, scored by guests.
- 10:30-11:15am in my Zoom room with guest evaluators Michael Morton (Deputy Director) and Melanie Strout (Community Engagement Manager) from the School + State Finance Project
- 11:30-1:20pm in my Zoom with guest evaluators Melanie Wilde-Lane (Executive Director) and Isabel Gonillo (Program Assistant) from the Connecticut Association for School Based Health Centers and Victoria Asfalg, Trinity ‘23, former TA for DataViz class, currently Policy and Data Analyst at Open Communities Alliance