ADD TITLE here

by ADD NAME(S) here

Last updated on ADD CURRENT DATE

for Data Visualization for All
with Prof. Jack Dougherty
Trinity College, Hartford CT, USA

Section 1

TELL AND SHOW your data story and visualizations. Notice how this paragraph appears in a larger font than others, because the HTML code begins with a "lead" class.

Compose your data story in your Google Doc, because it's easier to write and edit, especially when working with other people. When you're ready, go to this GitHub dataviz-story-template repo to create your own version, and publish it online using Settings > Pages. When your version is published, copy and paste the link into your README file so you can easily click it.

Everyone must demonstrate their ability to create their own sample version for the quiz. Later, if two people are working together to co-author one data story, you may wish to create ONE GitHub account that both of you can access. But only one person at a time can make edits.

In your GitHub copy of this template, open the `index.html` file to see how everything must be written in HTML format. Click the pencil symbol in GithHub to edit the file. HINT: In the upper-right corner, switch the dropdown menu from `No Wrap` to `Soft Wrap` to easily view long segments of code in your screen.

Paragraphs like this one must begin with a `p` tag and end with a `p` closing tag.

Links must begin and end with `a` anchor tags, with the web address inside either single or double quotes. If you need guidance, check out this W3Schools HTML Tutorial.

When describing charts, maps, or tables that appear further below, refer to them "...as shown in Figure 1" or "...as shown in Table 1" and include those figure/table numbers in the titles or captions below.

Embed each of your published visualizations as an HTML iframe code, following instructions in Chapter 9 of HODV, similar to the sample below.

ADD CAPTIONS like this -- Figure 1: Explore the interactive chart AND ADD your description of the chart here. Make sure your caption includes a direct link to your published chart or map in case the embed code fails to display.

Section 2

Create a separate section to describe how you obtained your data, key steps in your process, and cautions for interpreting its meaning. Write for an audience of future DataViz students who may wish to replicate your steps. Write in HTML format and always include links to data sources, such as CT EdSight, and also link to your shared Google Sheets.

Section 3

Give credit to people, organizations, resources, and tools that helped you to create this data story. Write in HTML format and include links when appropriate. When you paraphrase or quote from a specific reading, cite it using any standard academic citation style (such as MLA or APA inline citations), and include the full reference in a bibliography section at the end of your data story. For help with creating citations, I highly recommend the Zbib.org tool. Insert any URL, but you may need to click the Edit button to manually add missing details, such as author and date if the tool does not automatically recognize them, as shown in Image 1 and 2 below.

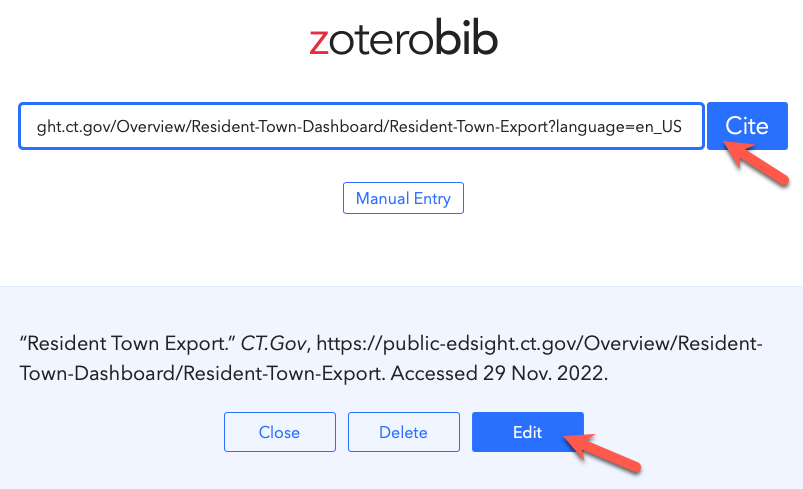
Image 1: After inserting a URL into the ZBib.org tool, you may need to click the Edit button to manually add missing details.

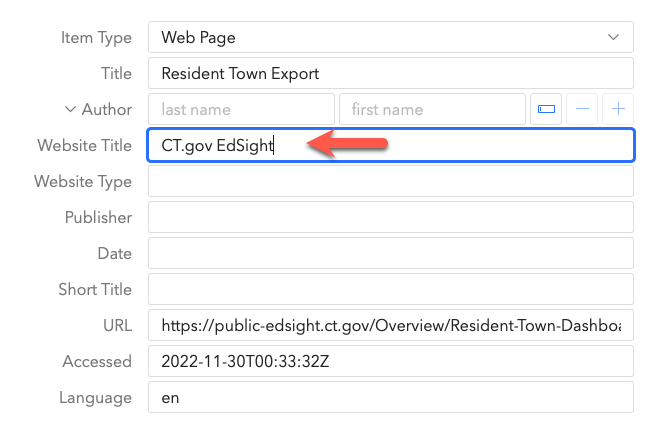
Image 2: Clicking the Edit button in ZBib allows you to enter or correct missing details, such as the full Website Title.

Below are sample sentences with MLA inline citations that would appear in the body of the data story, followed by the full references that would appear in the bibliography at the bottom:

Sample sentences

The City of Hartford recently created a housing code that requires the registration of the full names and contact information for all owners of apartment buildings -- including the officers of Limited Liability Corporations (LLCs) -- in order to "close municipal loopholes that allow anonymous slumlords to operate unchecked" (Lurye).

In most towns, the percentage of high-needs students enrolled in traditional public schools surpasses those enrolled in magnet, charter, and technical schools in the most recent academic year (“Resident Town Export”).

...later, insert a bibliography at the end of your data story:

Works Cited:

Lurye, Rebecca. “New Housing Code in Hartford Would Keep Slumlords from Hiding Behind LLCs.” Hartford Courant, May 31, 2019. https://www.courant.com/community/hartford/hc-news-hartford-housing-code-20190531-hcke2jo2x5fpdgz75xf4hlv2ki-story.html.

“Resident Town Export.” CT.Gov EdSight, https://public-edsight.ct.gov/Overview/Resident-Town-Dashboard/Resident-Town-Export. Accessed 29 Nov. 2022.


Optional Hint: To display a clickable web link in the bibliography, look at the HTML code in GitHub for the examples above. See how the URL appears twice: once in the "href" and again in the display text. This is not required for your data story, but it looks good and helps readers to click and view your sources.

Section 4: Advanced Tips

Change names of `Section 1` etc. to customized navigation labels that make sense for your data story, such as `Why It Matters` or `How We Made This` etc. To do this you must change names in TWO places: see the Navigation Container (around lines 30-50) and the corresponding Sections below. Keep the section numbers but change the reader-friendly labels.

Optional Subheaders: Use H4 tags to break up long sections

All of your data visualizations should be interactive. But if you need to insert a static image, you can upload a JPG or PNG to the GitHub repo, and insert it using the HTML img tag as shown below:

Figure 2: Describe your image in a caption, and always credit the source if someone else created it.

Change background colors

This template uses Bootstrap background colors. For example, search this `index.html` file for `bg-primary`, which sets the navigation bar (line 28), header (line 56), and footer (line 236) to blue. Changing it to `bg-secondary` switches those colors to gray.

Quickly Edit and View Changes on Your Local Computer

Instead of slowly making edits on GitHub and waiting for them to appear online, you can quickly make multiple edits in your local computer and view them instantly in your browser. Here's a list of steps:

  1. Go to your GitHub repo and select Code > Download Zip and uncompress the folder.
  2. Install a free code editor tool. My fav is the open-source Pulsar text editor but there are others, too.
  3. Open the "index.html" file with your code editor and make edits.
  4. In your browser, go to File > Open to view the "index.html" file that is on your local computer.
  5. In your code editor, save changes to your "index.html" file, then refresh your browser to instantly view your changes.
  6. After editing, upload the contents of "index.html" from your local computer to your online GitHub account, and view online.

Two Options for Tables

If you need to create a table, first try the Datawrapper Tables tool -- see HODV Chapter 8 -- and embed the results like this:

Table 1: Add your standalone caption here.

A second option is to use the Tables Generator HTML tool. Go to File > Import or manually enter your table data, then Generate the HTML code, and paste it here, similar to this sample:

Header A Header B Header C
123 456 789
987 654 321

Table 2: Add your caption here.