Educ 206: Data Visualization For All
J-term 2022 Syllabus
Due to the pandemic, our course meets remotely in the instructor’s Zoom room https://trincoll.zoom.us/my/jackdougherty on Tues-Wed-Thu-Fri from 9:15am to 12 noon ET for three weeks from 4 Jan to 21 Jan 2022.
Instructors
Professor Jack Dougherty, Trinity College, Hartford CT. Email me a quick question or schedule a Zoom appointment on my calendar.
Teaching Assistant Myri Ayala will co-host each class in the Blume Lab in LITS. Also, she is available for drop-in office hours on Tues-Wed-Thu 8-9pm ET in the Blume Lab and in her Zoom room or her email
Welcome video for J-term 2022 students with Jack Dougherty and Myri Ayala.
Course description: How can charts and maps tell meaningful stories? How can they mislead us from the truth? In this introductory hands-on course, we will create data visualizations in order to better understand design principles and develop a critical analysis of the field. Students will learn skills in both quantitative reasoning and digital storytelling as we advance from beginner tools to editing code templates. For the community learning component, our class will build interactive charts and maps on a public policy issue with a Hartford-area partner organization. No coding experience is necessary, but curiosity is required.
Fulfills requirement in Numerical and Symbolic Reasoning (NUM).
Cross-referenced with Community Learning, Public Policy & Law, Writing & Rhetoric, Urban Studies.
Enrollment limited to 19 students.
Community Learning Partner
Our partners at the CT Coalition Against Domestic Violence asked us to work with them analyze and visualize two years of data from CTSafeConnect.com, their new statewide phone/text/chat hotline that connects people requesting help with local domestic violence organizations.
Intro video for J-term 2022 students with CT Coalition Against Domestic Violence partners: Maria Guzman and Joanne Vitarelli
Custom Regions map based on CCADV Members Map
Course Materials and Tools
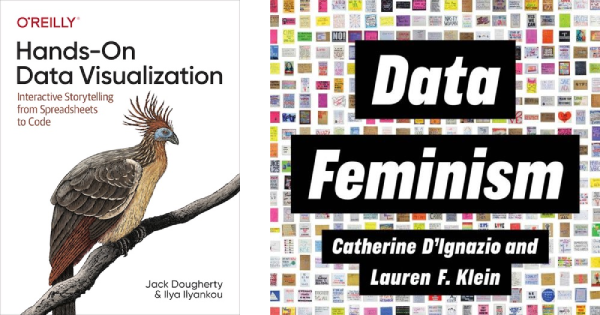
- Two open-access books are freely available online (or you can purchase print editions).
- Jack Dougherty and Ilya Ilyankou, Hands-On Data Visualization: Interactive Storytelling from Spreadsheets to Code (O’Reilly Media, Inc., 2021), https://HandsOnDataViz.org.
- Catherine D’Ignazio and Lauren F. Klein, Data Feminism (MIT Press, 2020), https://data-feminism.mitpress.mit.edu.
- Bring a laptop computer (Mac, Windows, or Chromebook) to every class. Install more than one browser (such as Firefox, Safari, Chrome) for testing purposes. Tell me if you need a temporary laptop loaner.
- You will need to sign up for several free web services (such as Google Drive, Datawrapper, GitHub). See my list of recommended free digital tools in this course.
Learning Goals and Assessments
In this course you will demonstrate the knowledge and skills you have developed to meet 10 broad learning goals (with more specific sub-goals listed in the schedule further below):
- Strengthen Your Spreadsheet Skills
- Find and Question Your Data
- Clean Up Messy Data
- Make Meaningful Comparisons
- Chart Your Data
- Tell and Show Your Data Story
- Map Your Data
- Transform Your Map Data
- Edit, Host, and Embed Code on GitHub
- Detect Lies and Reduce Bias
Your progress toward these learning goals will be assessed in three ways:
A. Open-Book Daily Quizzes
- The purpose is to demonstrate your knowledge and skills through questions that emphasize conceptual understanding and how to apply it in new contexts. You will have more than one opportunity to successfully complete each quiz while working independently with your notes, readings, and any web resources.
- Select any 2-hour period during the quiz window (typically from 12 noon to 11:59 pm) to complete a Moodle quiz of approximately 5 questions on the designated learning goal. You may see different versions of questions than other students, but all questions address the same goal.
- Students have at least two attempts on every quiz. Short-answer questions will be scored automatically by the computer, and show-your-work questions will be scored manually by the instructor. If you respond incorrectly to an auto-scored question, the quiz will offer advice and allow you to try again. If you respond incorrectly to a manually-scored question, the instructor will offer advice via email or a meeting and allow you to try again within 24 hours.
- Before you start the quiz, prepare by reading assigned chapters, doing practice exercises, and discussing the material with classmates who have not yet started it.
- When you start the 2-hour quiz period, you may use your materials (including your notes, the online book, and the entire Internet), but you must work independently and you may not communicate about the quiz content in any way (except with the instructors) until the quiz has closed. You are responsible for following the Intellectual Honesty policy as described in the Trinity Student Handbook. If doubts arise, the instructor may require you to retake a quiz under direct supervision and/or refer the issue to the Honor Council.
- If you do not begin a quiz or demonstrate sufficient effort during the initial quiz window, a 20 percent late penalty will be deducted for every 12-hour period beyond the deadline. Exceptions are granted only for documented health or family emergencies.
- 10 broad learning goals x 5 points per quiz = 50 points
B. Building Data Stories
- The purpose is to show your work in building different stages of data visualizations and written narratives that explain why and how it matters to our community partners.
- Depending on the stage of the build, your work will be evaluated by the instructor, your peers, or guest experts, based on a rubric.
- 8 stages worth 5 points each = 40 points. A 20 percent late penalty will be deducted for every 12-hour period beyond the deadline. Exceptions are granted only for documented health or family emergencies.
C. Class Participation
- The purpose is to encourage active learning and accountability. Each student begins the course with 10 participation points. You are expected to log into our Zoom class on time with your real screen name. During class, you may be randomly called on to discuss a concept in our reading, or to share your computer screen for everyone to view while we learn tools and build data stories. You do not necessarily need to know the correct answer. But if you are not present or not able to participate when called, a point will be deducted from your participation score. Exceptions are granted only for documented health or family emergencies, or scheduling conflicts where you have notified me well in advance.
Summary
50 points quizzes + 40 points data stories + 10 class participation = 100 total points. In this course, unsatisfactory work (below 70%) falls in the D or F range, adequate work (70-79%) in the C range, good work (80-89%) in the B range, and outstanding work (90 to 100%) in the A range. Each range is divided into equal thirds for minus (-), regular, and plus (+) letter grades. For example, 80 to 83.33% = B-, 83.34 to 86.67 = B, and 86.68 to 89.99 = B+. Access your individual assessments on the password-protected Moodle site for this course at https://moodle.trincoll.edu.
Academic accommodations: please notify me before our third class session, and schedule an appointment on my calendar to discuss how we will implement your approved plan. For those students with accommodations approved after the start of the semester, a minimum of 10 days’ notice is required. Learn more at the Student Accessibility Resource Center.
Religious observances: please notify me before our third class session regarding any scheduling accommodations.
How to Succeed in this Course
- Bookmark this online syllabus and check it often for updates, which will appear in bold.
- Keep a calendar (paper or digital) to manage your time and meet deadlines.
- Bring a laptop (with a fully-charged battery) to every class, and turn off distractions to help you (and others) focus on learning. Set notifications on digital devices to “Do Not Disturb.”
- Use a password manager to keep track of your digital accounts. See my introduction to Bitwarden, an open-source password manager with free core features for Windows/Mac/Linux computers, all major web browsers, and iOS and Android mobile devices.
- Take initiative and ask questions: during or after class, via email, or by appointment on my calendar. If you don’t understand something, other students probably are puzzled, too. Go ahead and ask.
- Meet up with other students outside of class. Create a small study group to review the course material and work together. The secret to success in college is teaching yourselves how to learn new material.
- If anything is interfering with your learning, email or talk with us about it. We care about how you’re doing in life, not just in our classroom.
Schedule
Our course meets remotely in my Zoom room https://trincoll.zoom.us/my/jackdougherty on Tues-Wed-Thu-Fri from 9:15am to 12 noon ET, with a 15-minute break around 10:30am. Always look for important updates from the instructor in bold.
Tues 4 Jan
- Before class, fill out this Google Form
- Introductions, syllabus overview, and how to succeed in this course
- Sample responses: What sparks your interest in this course?
- Sample quiz about syllabus for 1-point bonus, due in class on Moodle
- Overview of Learning Goal #1: Strengthen Your Spreadsheet Skills. Start reading and doing sample exercises in HODV Chapter 2 https://handsondataviz.org/spreadsheet.html
- Copy, Share, and Convert Google Sheets
- Geocode locations
- Sort and filter data
- Calculate with formulas
- Summarize with pivot tables
- Match columns with VLOOKUP
- Peer practice with spreadsheet skills in randomly-assigned breakout rooms.
- Prep for Spreadsheet quiz, to be taken during any 2-hour period before midnight tonight on Moodle
- Learn more about our community partner CT Coalition Against Domestic Violence https://ctcadv.org, and its statewide hotline program https://CTSafeConnect.org
- Start reading series of news articles (if needed, see login on our Moodle page):
- Clare Dignan and Veronica Del Valle, “Lost to Abuse: Intimate Partner Violence,” Connecticut Post series, 2021, https://www.ctpost.com/projects/2021/intimate-partner-violence/.
- Clare Dignan, “After Almost 300 Intimate Partner Violence Deaths in Connecticut in 20 Years, Has Enough Changed?,” Connecticut Post, December 8, 2021, https://www.ctpost.com/projects/2021/intimate-partner-violence/protective-restraining-orders/.
- Clare Dignan, “Race, Wealth Still Dictate Which Stories of Domestic Violence Get Told, Experts Say,” Connecticut Post, December 8, 2021, https://www.ctpost.com/projects/2021/intimate-partner-violence/public-attention/.
- Clare Dignan, “7 Takeaways from Our Investigation of Intimate Partner Violence,” CT Insider, December 12, 2021, https://www.ctinsider.com/news/article/7-takeaways-from-our-yearlong-investigation-of-16688932.php.
- Recommended: meet up with your friendly instructors!
Wed 5 Jan
- Overview of Learning Goal #2: Find and Question Your Data. Start reading HODV Chapter 3 at https://handsondataviz.org/find.html
- Challenge power & privilege in data
- Clarify levels of data
- Recognize public vs private data
- Mask or aggregate sensitive data
- Explore open data repositories
- Source your data
- Recognize bad data
- Question your data
- Explore CTSafeConnect2020 masked data Google Sheet requires password and also review data service definitions
- Assign Build Stage 1: Explore CTSafeConnect Data. Explore the data. What do you notice? What do you need clarification about? What questions can we ask about the data that might help our community partners? Work with your randomly-assigned classmate(s) to co-author a Google Document that addresses these items (thoughtful lists or short paragraphs are fine), SHARE it so that anyone can view, and put your names at the top. Paste the link to your shared Google Doc here in Moodle on Wed 5 Jan before midnight, to give the instructor time to compile them for our Thursday meeting with the community partners. Worth 5 points.
- Start reading Catherine D’Ignazio and Lauren Klein Data Feminism chapters 1 and 2 https://data-feminism.mitpress.mit.edu, especially these selections:
- Chapter 1. Power Chapter begins with a story about tennis star Serena Williams. What do the authors mean by this line? “What we choose to measure is a statement of what we value…and who we value”
- Chapter 2 about Challenge Power begins with a comparison of two different maps of Detroit. How do the maps differ, and what do the authors mean when they ask “Who makes maps and who gets mapped?”
- How do these themes connect to last night’s reading? Clare Dignan, “Race, Wealth Still Dictate Which Stories of Domestic Violence Get Told, Experts Say,” Connecticut Post, December 8, 2021, https://www.ctpost.com/projects/2021/intimate-partner-violence/public-attention/.
- Prepare for Find and Question Data quiz, to be taken during any 2-hour period before midnight tonight on Moodle
Thu 6 Jan
- Overview of Learning Goal #3: Clean Up Messy Data. Start reading HODV Chapter 4 at https://handsondataviz.org/clean.html
- Smart Cleanup in Google Sheets
- Find and Replace with Blank
- Transpose Rows and Columns
- Split Data into Separate Columns
- Combine Data into One Column
- Prepare for Clean Up quiz, to be taken during any 2-hour period before midnight tonight on Moodle
- Peer practice: Download and Clean Census/ACS data from Social Explorer
- Review and Narrow Down our Data Story Ideas
- 11am Zoom meeting with community partners Maria Guzman and Joanne Vitarelli, CCADV / CTSafeConnect
Fri 7 Jan
- Continue Discussion of Data Story Ideas
- Overview of Learning Goal #4: Make Meaningful Comparisons. Start reading HODV Chapter 5 at https://handsondataviz.org/comparisons.html
- Precisely describe comparisons – practice in this Google Sheet
- Normalize your data
- Beware of biased comparisons
- Prepare for Meaningful Comparisons quiz, to be taken during any 2-hour period before midnight tonight on Moodle
- Assign Build Stage 2: Find Meaningful Demographic Comparisons by merging Census/ACS town data and CTSafeConnect 2020 regional data, in randomly-assigned duos/trios, due Mon 10 Jan at 12 noon
Tues 11 Jan
- What we learned last week and what we’ll learn this week
- Review of Quiz #4 normalization – see sample responses by Archana and Daisy
- Overview of Learning Goal #5: Chart Your Data. Start reading HODV Chapter 6 at https://handsondataviz.org/chart.html
- Chart types
- Chart design principles and rules
- Create bar/column, histogram, line, area charts
- Create annotated, range, scatter charts
- Prepare for Chart Your Data quiz, to be taken during any 3-hour period before midnight tonight on Moodle. Budget your time for this quiz, which contains 5 show-your-work questions, and may require more time than you have spent on prior quizzes.
- Review of Build Stage 2 – see sample responses by Alberlis and Tim
Wed 12 Jan
- Class begins today at 9:30am
- Explore Two Ways to Make Meaningful Comparisons with imaginary data
- Overview of Learning Goal #6: Tell and Show Your Data Story. Start reading HODV Chapter https://handsondataviz.org/story.html
- Build Narrative on a Storyboard
- Draw Attention to Meaning
- Acknowledge Sources and Uncertainty
- Prepare for Data Story quiz, to be taken during any 2-hour period before midnight tonight on Moodle. The quiz asks one question: use any CTSafeConnect time data to create a meaningful annotated chart, and add a title and annotations that draw our attention to what matters. See Datawrapper annotated chart tutorial to create text annotations and/or highlight ranges. See CTSafeConnect 2020-2021 masked time data
- Individual meetings with instructor to discuss your interests in specific Data Story Ideas
- Talk with other students in breakout rooms to discuss potential duos or coordinated solos for data story ideas
Thu 13 Jan
- Overview of Learning Goal #7: Map Your Data. Start reading HODV chapter https://handsondataviz.org/map.html
- Map types (focus primarily on point maps and choropleth maps)
- Map design principles and rules
- Choropleth colors and intervals (focus on basic concepts for now)
- Normalize choropleth map data
- Create choropleth maps with Datawrapper
- Prep for Map Your Data quiz, to be taken during any 2-hour period before midnight tonight on Moodle. Budget time for two show-your-work mapping questions, and one short-answer question.
- 11am Zoom meeting with community partners Maria Guzman and Joanne Vitarelli, CCADV / CTSafeConnect
- Share and discuss some preliminary findings, with brief explanations from Tim (sheet 1), Alberlis (sheet 2), Archana, Chris, Daisy, Azka (sheet 3)
- Continue to focus our Data Story Ideas
Fri 14 Jan
- NEW: Updated 2020-2021-SafeConnect-masked Google Sheet requires password with new column: 2YearInstance, which counts repeat calls during 2020 and 2021.
- Construct pivot tables with filters and multiple values to organize your data
- Overview of Learning Goal #8: Transform Your Map Data. Start reading HODV Chapter 13 https://handsondataviz.org/transform.html
- What’s a GeoJSON file and why does it matter?
- Explore CCADV-custom-regions on GitHub and click Code > Download Zip and uncompress in your local computer
- Find and edit GeoJSON boundary data with Mapshaper.org
- Upload a custom GeoJSON boundary file to make a choropleth map in Datawrapper
- Prep for Transform Your Map Data quiz, to be taken during any 2-hour period before midnight tonight on Moodle. This quiz features one show-your-work question: create any meaningful choropleth map using our updated 2020-2021 CTSafeConnect data and the CCADV 14-region GeoJSON boundary, both linked above.
- Finalize and select our Data Story Ideas and coordinate solos/duos
- Assign Build Stage 3 & 4: Create Data Story including text, table, chart, and map in a shared Google Docs, due Monday 17 Jan by 3pm. Worth 10 points.
Tues 18 Jan
- Current lineup on Data Story ideas
- Assign Build Stage 5: Peer Review of Data Story, work in 2-person breakout rooms, then meet in 4-person rooms to discuss with authors
- Feedback from instructor’s review of Build 3 & 4, in class meetings about 5 minutes each (instead of break today)
- Create a free account on Github
- Abbreviated Overview of Learning Goal #9: Edit, Host, and Embed Code with GitHub. Start reading HODV Chapter Chapter 9 https://handsondataviz.org/embed.html and chapter 10 https://handsondataviz.org/github.html and
- Static images versus interactive iframes
- Get the iframe embed code for a published visualization
- Embed the iframe code in an HTML web page
- Use this dataviz-story-template from GitHub
- Assign Build Stage 6 and Quiz 9 (together worth 10 points): Revise Data Story and Embed in GitHub Template, due today before midnight, and place one link per duo/solo in Data Stories page. There is no separate Moodle quiz.
Wed 19 Jan
- Workshop to prepare Data Stories presentations
- Work solo/duo in your own breakout rooms to finalize your data stories
- TA Myri will visit each breakout room to help you plan and rehearse 1-minute oral presentation of highlights
- Main room: see meeting times to review content and GitHub Pages with Jack
- 11am-12pm Zoom meeting with CCADV community partners Maria Guzman and Joanne Vitarelli to present data stories and listen to feedback. May include additional guests from Trinity College. Be prepared to deliver a 1-minute presentation of highlights. To conserve time, Jack will share each data story using his screen, so tell him to scroll down as needed during your presentation.
- Assign Build Stages 7 and 8: Submit your final data story as a GitHub Pages link on our Data Stories page. On Wed 3pm I will “freeze” your work and send a copy of your GitHub repo to the guest evaluators to give them time to read your work before Friday morning. See instructions for guest evaluators. Worth 10 points.
Thu 20 Jan
- Overview of Learning Goal #10: Detect Lies and Reduce Bias. Start reading HODV Introduction https://handsondataviz.org/introduction.html and Chapter 14 https://handsondataviz.org/detect.html
- How to Lie with Charts
- How to Lie with Maps
- Recognize and Reduce Data Bias
- Recognize and Reduce Spatial Bias
- Prep for Detect Lies quiz, to be taken during any 2-hour period before midnight tonight on Moodle
- Why data visualization matters to me
- Telling and showing hidden stories of inequality in On The Line book-in-progress
- Next data project with community partners: The Sheff v O’Neill 2020 school integration legal settlement calls for data transparency in section V on page 7. What are good ways to clearly show disaggregated student data from city & suburban magnet schools to the public? Join us in Educ 308: Cities Suburbs & Schools, TR 10:50-12:05 Spring 2022 (email me if you need permission).
- Student Course Feedback on Google Doc
Fri 21 Jan
- 9:15 to 10:30am ET: Final evaluation Zoom meeting with guest experts Clare Dignan, investigative reporter who wrote Lost to Abuse CT Post series and Ilya Ilyankou ‘18, civic technologist at CT Data Collaborative. Guest experts will review final data stories online before the event. Each solo/duo will have 1 minute to orally present key points, then about 5 minutes to respond to questions from evaluators about your data analysis, storytelling, and design decisions. Worth 10 points, scored by guest evaluators.