Visualizing Connecticut Food Scrap Pilot Programs: Representation, Participation, and Benefits

Shayla Whitaker ‘25
Community Learning Research Fellow

December 11, 2023

Community Partners:
CT Dept. of Energy and Environmental Protection and
the Center for Leadership and Justice
with Prof. Jack Dougherty
Trinity College, Hartford CT, USA

Introduction

In response to Connecticut’s growing “trash crisis,” the Department of Energy and Environmental Protection (DEEP) awarded over $4 million to local governments to launch food scrap pilot programs. A primary goal of this program, officially known as Sustainable Materials Management (SSM) Grants, is to divert household food scraps from municipal solid waste, more commonly known as trash. Diverting food scraps away from solid waste matters because it’s one of the heaviest types of waste and removing it would reduce the amount of waste going to landfills and incinerators significantly. Food scraps can be anything from eggshells to meat trimmings.

What lessons can we learn from Connecticut’s food scrap pilot programs? This study provides an overview of 15 towns that accepted SSM grants, that got to create their own voluntary pilot program with curbside or transfer station collection of food scraps and/or pay-as-you-throw, with more in-depth analysis of West Hartford, that opted for a small food scraps collection program, and Stonington, that opted for a town wide food scraps collection program, using publicly-accessible data and visualization tools to tell a broader story. More specifically, the study poses three research questions:

  1. Representation: How representative are demographics (racial, socioeconomic) of the pilot program participants when compared to the greater town or city where it is located?
  2. Participation: What are the participation rates and food scraps tonnage of the participating pilot programs in CT and how do they compare to each other? How do the demographics of the programs compare with the participation rates?
  3. Benefits: What are the economic and environmental benefits of removing food scraps from our waste streams in Connecticut?

The goal of pilot programs is to understand the value, challenges, and scalability of the program. For a program to be implemented on a larger scale it is important to look at participation rates to understand if this is a program people want in their town to determine if it will work on a broader scale. One factor that is important to acknowledge in participation is how it correlates to representation of differing demographics, and how that can affect participation rates. Furthermore, if a pilot program is to be implemented there has to be a benefit.

These are important questions to both CT DEEP and the Center for Leadership and Justice. CT DEEP is providing these grants to towns so it is important for them to understand the strengths and weaknesses of the programs they are funding. Furthermore, a subsection of the CLJ, the Greater Hartford Interfaith Action Alliance (GIHAA) heavily advocated for H.B. 6664, the closing of Materials Innovation and Recycling Authority (MIRA) so it is important to them to keep that facility closed and ensure none other like it open by searching for alternative disposal methods.

Overall, of the 15 towns that accepted grants, I focused on collecting data from 5 towns that had food scraps collection as part of their pilot programs. Of those five towns only two towns publicly shared data. When analyzing those two towns, West Hartford and Stonington, both tended to be whiter, have greater incomes, and more home ownership. When we compare the diversion rates, the amount of food scraps removed from municipal solid waste, West Hartford diverted more than double the rate of Stonington.

Why do we have a “Trash Crisis”?

We are dealing with a “trash crisis” because there is more waste than environmentally friendly disposal options. Sending our waste to landfills away from the communities that generate it creates a greater negative environmental impact. Across the United States 63,130,000 tons of food waste were generated accounting for 21.59% of all municipal solid waste in 2018. In the same year half of all waste went to landfills with food scraps accounting for 24.14% or 35,280,000 tons (“National”). This is to say that about 21% of the garbage we set out on our curb each week is food scraps, and about half of those food scraps will end up in landfills. Food scraps in landfills generate methane, one of the most dangerous greenhouse gasses to climate change. According to the US Environmental Protection Agency it accounts for 58% of methane emissions in municipal solid waste landfills (“Quantifying”).

In Connecticut waste to energy incinerators are being used as alternatives to landfills, however this creates many environmental issues that are disproportionately affecting people with low income and people of color. One example of this can be seen in Hartford Connecticut (“Connecticut”; “We are”). The closing of the Materials Innovation and Recycling Authority (MIRA) waste-to-energy plant in 2022 created a predicament for Connecticut waste management. Due to its closure Connecticut is estimated to ship 860,000 tons of waste a year to out-of-state landfills. This is a costly process due to shipping for disposal and tipping fees which depend on weight (Spiegel).

How can Diverting Food Scraps Help Address the Trash Crisis?

Food scraps are one of the heaviest types of waste being disposed of. There are multiple ways of dealing with food scraps like composting and anaerobic digestion. Food scraps, sometimes referred to as organic waste, is any kind of food product, leafy greens, vegetables, meats, fish, bones, fatty oils, and more (“Composting”). There are many ways to deal with food scraps and depending on how you or your municipality decide to dispose of food waste.

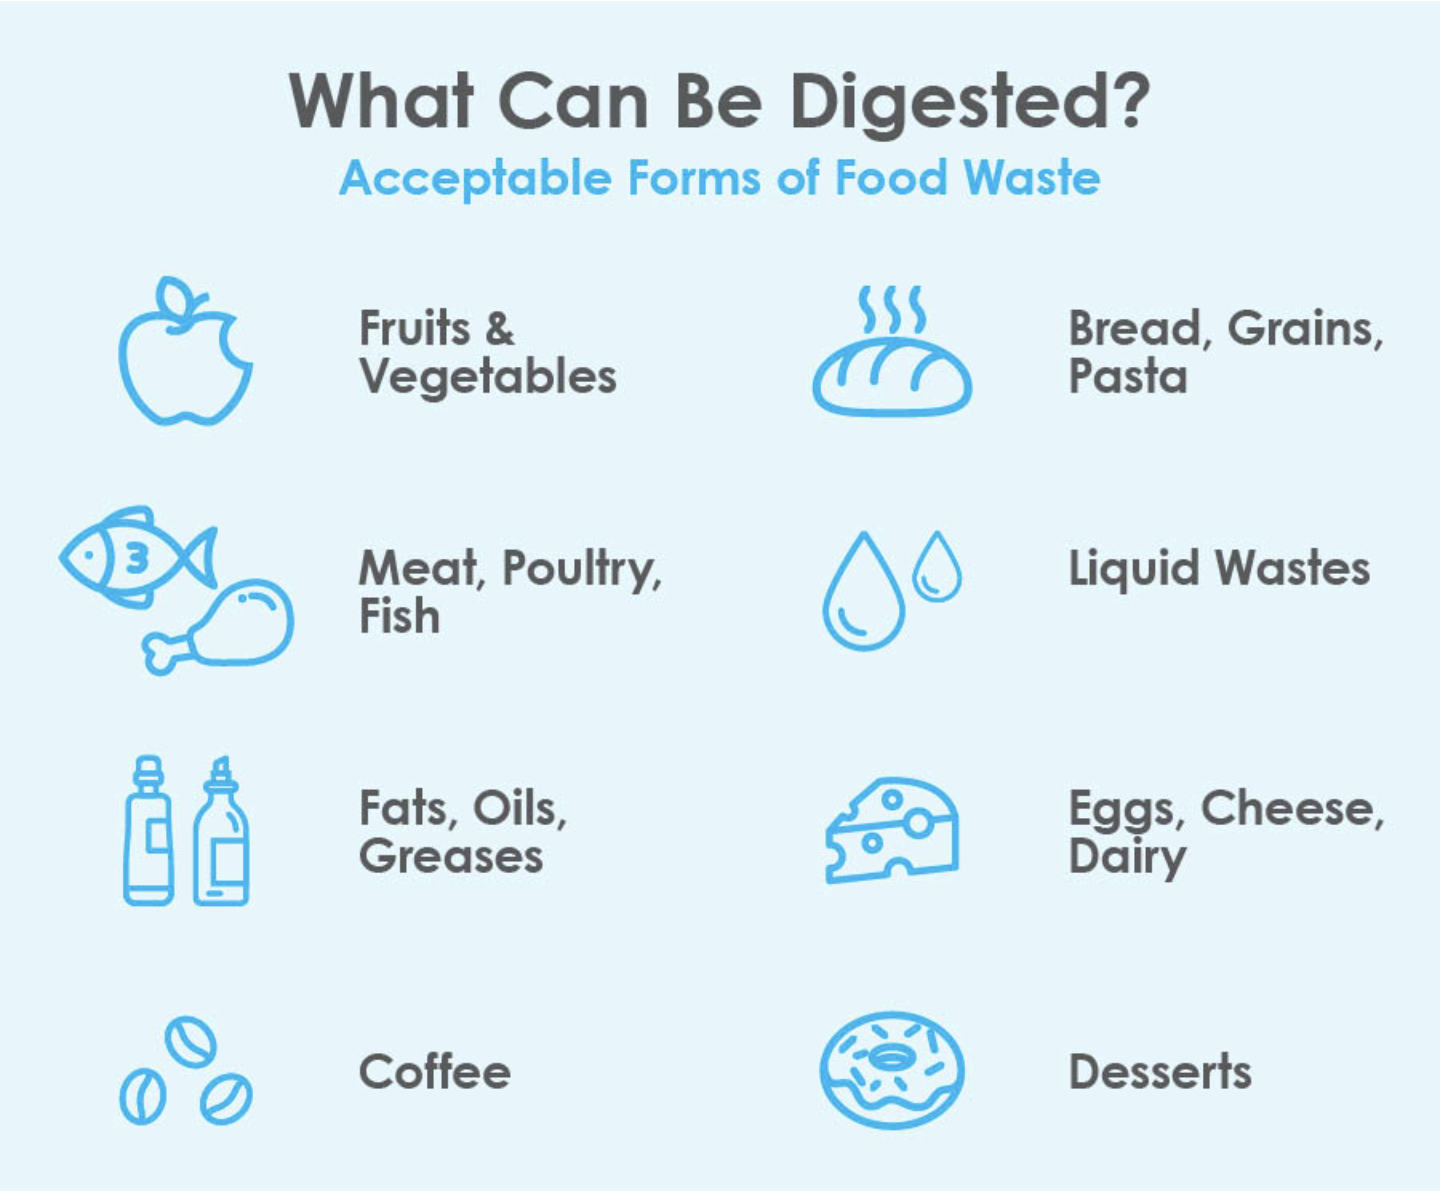
Figure 1. Examples of accepted food scraps by Quantum Biopower, an anaerobic digester in Southington, CT. [Source: Quantum Biopower]

One way of disposing of is through composting, an aerobic process in which food waste is broken down by microorganisms in the presence of oxygen to produce a dark soil-like organic material called compost that can be used to enrich farms and gardens (Barrett).

This can be done right at home in one's own backyard. Collecting food scraps and letting them digest in a bin in a backyard or this can be done indoors through vermicomposting with worms. When composting at home one will want to avoid food waste such as meat, fish, bones and fatty oils since it's harder to break these down (“Composting”). However, when done at a larger scale different rules can apply.

New York City recently developed an organic waste program in which all the waste collected goes to regional composting facilities. Composting on a large scale like this qualifies different food waste than composting at home. For example, meat, fish, bones and fatty oils can all be put in the food waste. Additionally, food-soiled paper such as tea bags, coffee filters, napkins, and paper plates are not traditionally composted but due to the scale are acceptable (“Organics”). However, not all facilities are the same and it's important to pay attention to what a municipality accepts as compost.

An alternative to composting, which is being used in most food scraps pilot programs in Connecticut, is anaerobic digestion. This is done at large facilities such as Quantum Biopower where food waste can be turned into biogas, a cleaner source of energy (“Anaerobic”). Additionally, a co-product called digestate can be used as fertilizer (“How does”). Quantum Biopower accepts all food scraps, however, they don’t accept food-soiled waste like the composting facilities in NYC so it’s important to check with municipalities what is being accepted in the food waste since it can differ by facility and disposal method.

Figure 2. Anaerobic digesters intake organic materials such as food scraps, and outputs biogas to create electricity, and digestate that can be used as fertilizer. [Source: Quantum Biopower]

What can we learn from food scrap collection programs in other states?

Residential food scraps waste collection programs are becoming increasingly more prevalent across the United States. There are currently 700 communities across 25 states participating and giving nearly 15 million US households access to food scrap collection programs (Pinkerton). Although the number of food scraps programs are increasing, it is difficult to learn about their effectiveness because only a third reported participation rates that greatly varied form 30-95% due to difference in calculation methods (Pinkerton).

Additionally, the successes of food scraps programs can be difficult to compare to each other because they do “not have a universal result reporting method.” (Alia). For example, in calculating diversion rates a common measurement was “pounds per capita” however, this is not a good measurement for comparisons when programs varied who they served with some only serving single-family households, while others included apartments, and businesses (Alia).

One program that we can learn from is Cambridge, MA, US. They ran a city-wide curbside food scraps program accessible to 117,000 people with an estimated 50% participation rate (Corrin). Additionally, they estimated that 7 tons of food scraps were collected per day which can make a big economic difference (Skahill). Cambridge pays $109 per ton to dispose of solid waste and $65 per ton to compost food scraps. This is a $44 difference per ton, which can begin to make a large difference if food scraps are continued to be diverted at larger rates.

Which CT Towns got Approved for Reimbursement Grants?

One solution being brought up by Connecticut's Department of Energy and Environmental Protection (DEEP) is to separate out food scraps due to it being one of the heaviest materials in the waste stream. In October 2022 awarded nearly 5 million dollars in grants to 15 towns to help municipalities start food scraps and/or unit-based pricing collection programs to reduce waste (CT.gov). In May 2023 they awarded an additional $577,100 to 4 additional towns. In total 19 towns were approved for Sustainable Materials Management grants. These grants are to be used to reimburse towns for program costs such as tipping fees, hauling fees, food scraps buckets, and trash bags (CT.gov).

Towns awarded grants were able to create voluntary programs by their own design. These programs could consist of food scraps collections via a new hauling route or co-collected with regular trash. Towns also had the option of implementing unit-based pricing (UBP), also referred to as pay-as-you-throw (PAYT), in which people pay a small fee for every unit of solid waste they throw away, typically by the bag. Towns were able to choose which diversion method they wanted to focus on. This study looks more specifically at food scraps pilot programs, not UBP programs.

All of these towns were approved for grants; however, their programs are in varying states. Many towns have decided to move forward and have begun pilot programs, some towns are still in the planning stages, and others decided not to accept the grant. A total of 15 towns decided to move forward with the Sustainable Materials Management Grants. Green towns have opted for curbside pickup programs, yellow towns have transfer station drop-offs, blue towns are still in development, orange towns have decided to conclude their pilot programs, and red towns decided not to move forward with the grant.

Figure 3. Map of CT towns approved for reimbursement grants.

West Hartford Case Study

West Hartford was one of the towns that accepted a Sustainable Materials Management grant. They received $109,000 to design a organics-specific curbside collection program to be hauled by Blue Earth serving 700 homes within a small subsection of West Hartford.

Figure 4. Example of composting bucket used in West Hartford pilot area being collected by Blue Earth. [Source: Youtube Video by Luciana Granstrand]

The pilot area selected is a part of Census Tract 4970. The pilot program began May 1, 2023 and it intends to run for 9 months.

Figure 5. The pilot area of the program compared to the Census Tract 4970 and the town of West Hartford.

The majority of the pilot area is a part of Block Groups 2 and 3 of Census tract 4970. However, because they don’t fit perfectly it's better to generalize the pilot area to the demographics of census tract 4970. This will also have more accurate data due to having a greater sampling audience.

Next, let’s compare how representative the pilot area is relative to the entire town of West Hartford. The pilot area accounts for 3% of the town. Overall, the Census Tract has about a 25 percentage point higher home ownership rate, about $79,000 higher in income, and is about 11 percentage points whiter, than the town of West Hartford overall, as shown in table 1 below. It is important to look at these demographics to understand how representative the pilot area is compared to a larger area. We can speculate that different populations may be inclined to participate more. For example, if there is a large amount of homeownership then people will presumably be living there for a long time and would be inclined to care about how they can improve their town while renters may be there temporarily and not know a lot about the town.

Table 1. Comparing the demographics, race, income, and home ownership of Census Tract 4970 to the town of West Hartford.

Of the 700 households eligible to participate, there has been an average of a 46% participation rate over the first 6 months in the food scraps pilot program. The participation rate declined slightly from the start of the program in May until October, as shown in Figure 6 below. This is a good participation rate when compared to other programs such as Cambridge that had an estimated 50% participation rate (Corrin). West Hartfords program is only 4 percentage points lower in average participation rate. Additionally, making these programs mandatory would likely help to increase participation rates.

Figure 6. The food scraps participation rate of the West Hartford pilot area from May to November.

Lastly, it is important to consider both the potential economic and environmental benefits of the program. Over the last 7 months West Hartford has collected 40 tons of food scraps and 195 tons of municipal solid waste. This allows us to calculate a diversion rate, meaning the percentage of food scraps collected that were diverted away from the municipal solid waste stream. Here we define diversion rate as tons of food scraps divided by the net total waste (combined total of food scraps plus municipal solid waste). In total, the town of West Hartford had a 17% food scrap diversion rate during the first seven months of its 2023 pilot program.

Table 2. West Hartford food scrap pilot program outcomes, May-Nov 2023.

The food scraps are disposed of at Quantum BioPower for $65 per ton while the municipal solid waste goes to Covanta, an incinerator in Bristol for $89 per ton. That means for each ton of food scraps diverted from Covanta to Quantum Biopower, West Hartford saved $24. Overall, West Hartford has saved about $954 by diverting 17% of their food scraps out of the waste stream. It is important to remember that this is saving for a pilot program of 700 households with an average participation rate of 46%. Scaling this up can have significant economic benefits. Furthermore, there could be additional costs reduced due to hauling costs for vehicles, gas, and man hours that were unable to be calculated.

>

Stonington Case Study

GStonington was another town that received a Sustainable Materials Management Grant. Their grant was for $550,000 to create a town-wide organics-specific curbside side collection program available to 8,800 households to be hauled by F.E. Crandall Disposal. The program began on January 23, 2023 and intends to run for 12 months.

Figure 7. The pilot area of Stonington compared to the State of Connecticut.

Unlike West Hartford, Stoningtons program is town wide so there is no way to compare the demographics of the pilot area to the town, but we can compare Stonington to Connecticut as a whole. Overall, Stonington is about 6 percentage points more home ownership than, about $7,000 higher in income, and 13 percentage points whiter more home ownership than Connecticut overall. Once, we should remember that results from this pilot program may not necessarily be representative of the entire state.

Stonington, similar to West Hartford Census Tract, are whiter, have a greater income, and more homeownership than the greater areas they are being compared to. Stonington is more representative of Connecticut than Census Tract 4970 is of West Hartford.

Stoningtons didn’t track participation rates like West Hartford did and there wasn’t a way to make an approximation of it.

Next, we can look at the environmental benefits of the program thus far. Stonington has collected 144 tons of food scraps and 2,540 tons of municipal solid waste for a total of 2684 combined tons between January and August 2023. By dividing the tonnage of food scraps by the total the diversion rate of the program can be calculated. Over the first 8 months of the program there has been a 5% total diversion rate of food scraps out of the municipal solid waste.

Table 4. Stonington food scrap pilot program outcomes, Jan-Aug 2023.

Although Stonington's diversion rate is lower than West Hartford it steadily increased across the first 8 months of the program. The diversion rate peaks at 8% in August and assuming the trend continues the diversion rate would increase. While Stonington only averaged a 5% diversion rate from January to August 2023, that was due to only having one week's worth of collection data for January skewing the diversion rate. Their diversion rate slowly increased and peaked at 8% in August, therefore, a more fair estimate of Stonington's diversion rate would be 5-8%, which is about half of West Hartford's 17% diversion rate.

Figure 8. Stoningtons diversion rate from January to August 2023.

To further understand Stonington's diversion rate it should be noted that the town has had unit-based pricing since the 1990s. Therefore, one can speculate that Stonington’s diversion rate may be low because this pay-as-you-throw policy already taught residents to reduce overall waste, which would have lowered their food scraps diversion rate as a percentage of total waste.

Also, this study was not able to identify any economic savings from food scraps collection for Stonington. The reason is that the town currently pays the same tipping fee ($61 per ton) for food scraps (shipped to Quantum Biopower in Bristol CT) and solid waste (shipped to the incinerator in Lisbon CT) due to subsidies provided by Southeastern Connecticut Regional Resources Recovery Authority (SCRRRA). At first glance, when tipping fees are identical for food scraps and solid waste, there are no obvious cost savings from the pilot program. However, this doesn’t mean there weren’t any economic differences since there may be other costs that go into hauling (such as costs for vehicles, fuel, and labor hours), but they could not be calculated in this study.

Looking in the near future for both West Hartford and Stonington, the tipping fees for municipal solid waste are expected to rise. DEEP estimates that currently towns on average pay $110 per ton for municipal solid waste disposal but it is expected to rise to $125 per ton (“Sustainable”). Additionally, tipping fees for food scraps disposal are currently estimated to be $75 per ton on average and could drop to $40 per ton in the future. This would further the economic benefits of these programs if food scraps are on average $85 less per ton, but these markets are volatile and the estimates of tipping fees are subject to change.

>

Comparing Diversion Rates between West Hartford and Stonington

The West Hartford and Stonington pilot programs were both organic-specific curbside collection programs. One of the most important parts to study about this program is the diversion rate. This tells us out of the total waste, municipal solid waste and food scraps, what percent of food scraps has been diverted. During West Hartfords program 17% of the combined waste has been food scraps, while 5-8% of Stonington's waste has been food scraps

Figure 9. Comparing the diversion rates of West Hartford and Stonington's food scraps pilot programs.

These are voluntary programs and it's important to consider how that would change the diversion rates. Currently on average 46% of West Hartford's pilot programs are participating and there is a 17% diversion rate, if the whole pilot area participated it would likely raise diversion rates to the EPAs estimated 21% of food waste in curbside scraps. This would mean the majority of food scraps would be removed from the waste stream.

>

Methods

Collection

I began by contacting Blue Earth about food scraps tonnage for the West Hartford Pilot Program to understand the type of data being collected. I received 2 weeks of data about the number of pickups by street and total tonnage for that week. Using this information I began to reach out directly to the towns of Meriden, Middletown, Stonington, West Hartford, and West Haven. Each town was contacted by phone and then sent a follow up by email using the data I received from Blue Earth as an example of the kind of data that I was looking for. Of the five towns that I had requested data from, I received data from two towns, West Hartford and Stonington. West Hartford had municipal solid waste tons, food scraps tons, and food scraps participation rate broken down by week. Stonington shared municipal solid waste tons and food scraps tons broken down by month.

To collect demographic data to analyze representation I used the website Social Explorer to retrieve American Community Survey 2017-2021 5-year Estimates for race (A03001), median household income (A14006), and tenure (A10060). These estimates are made using US Census Bureau data. The American Community Survey 2017-2021 5-year estimates are based on Census data collected during the Covid-19 pandemic that may have skewed data collection and not be fully representative of the demographics.

To organize this data, I aggregated it all into a Google Sheet with tabs pertaining to demographics and food scraps for each town.

Analysis

When looking at this data it is important to remember that all calculations are estimates based on accessible data. Using formulas in Google Sheet I calculated the average participation rate. To calculate representation I took the difference between Census Tract 4970 and West Hartford for each demographic. Next, environmental benefits were calculated by totaling food scraps and municipal solid waste tons and then taking the food scraps tons and dividing it by the total. Economic benefits can be calculated by taking the difference in fees for Quantum Biopower and Covanta and multiplying it by food scraps tons collected.

Calculations were different for Stonington because there was no participation data and there were no economic benefits to observe due to equivalent fees for Quantum Biopower and Lisbon Incinerator. Representation was calculated in a similar manner to West Hartford by taking the differences in each demographic to interpret how Stonington deviated from Connecticut. The environmental benefit diversion rate was also calculated for Stonington by taking the total of food scraps and municipal solid waste collected in the same time period and then dividing food scraps tons by the total.

Further environmental benefits and economics could be potentially calculated using the EPAs Waste Reduction Model (WARM). This model has the ability to estimate potential greenhouse gas (GHG) emissions reductions based on waste management and economic impacts based on hours, wages, and taxes.

Visualization

To create these visualizations a website called Datawrapper was used. The maps were created by using Mapshapper to specify certain areas on the map. West Hartford, Census Tract 4970, Stonington, and Connecticut were all selected. Each area was exported from Mappaper as a geojson file that were each imported into Datawrappers’ locator map feature allowing the maps to highlight the pilot areas. The graphs and charts were created by taking the aforementioned Google Sheet and entering it into Datawrapper.

>

Policy Recommendations About Data Limitations

  1. Require Uniform Data Collection: In data collection I learned that the types of data West Hartford and Stonington collected were not uniform, and that is presumably true for the other pilot programs. Furthermore, each municipality had the chance to design their own program, which created more incongruity across data collection. Without uniform data it is not easy to compare the effectiveness of the food scraps collection programs. If CT DEEP funds future pilot programs, it should provide towns with a template about the data they are required to collect and report, such as: tons of food scraps, tons of solid waste tons, the number of households that put out food scraps each week, and tipping fees for both food scraps and solid waste.
  2. Share Public Data: I contacted staff at five towns that operated curbside food scrap pilot programs, but only two of them shared public data (West Hartford and Stonington). Data was not provided by Middletown, Meriden, and West Haven. Middletown staff reported that they were unable to share data because they were preoccupied implementing a permanent version of their pilot program. Meriden and West Haven did not share data because they said CT DEEP was not amenable to them sharing town data at the time of request. When I directly asked CT DEEP for the data, their staff declined on the grounds that another party had previously submitted a Freedom of Information Act (FOIA) request for the food scraps data, and until that request was resolved, they could “not skip over it” and share the data with me. Using FOIA as a reason to not share data is a very frustrating conundrum, because the original intent of FOIA is for the government to provide public data upon request (“Citizens”). Being unwilling to share public data defeats the purpose of government-funded pilot programs because if the results are not publicly shared by design, then the public cannot learn from the experiment.

Acknowledgements

Thank you for your support throughout the process to my community partners: Chelsey Hahn, Environmental Analyst at the Connecticut Department of Energy and Environmental Protection (CT DEEP) and Sarah McCoy, Community Organizer and Grant Writer at the Center for Leadership and Justice (CLJ). Thank you to additional DEEP staff who gave me feedback on my final draft, including Chelsey Hahn, Chris Nelson, Jennifer Weymouth, and Luciana Granstrand. The contents of this essay are the responsibility of the author, and do not necessarily represent the views of the community partners.

Thank you to local government officials who shared public data with me: Katherine Breer Bruns, Recycling Coordinator for the Town of West Hartford, and Jill Senior, Director of Solid Waste & Recycling for the Town of Stonington.

Thank you to Professor Laura Holt (Psychology) and Professor Erica Crowley (Director of Community Learning) for hosting the course and your guidance throughout it.

Thank you to my Faculty Advisor, Professor Jack Dougherty (Educational Studies) for the endless support and guidance.

References

Alia Rizvi Haque, "Food Scrapping Programs and Smart Practices for SB 1383 Compliance in Ten Selected Bay Area Cities," Master's thesis, San Jose State University, 2019, pp. 16-18, https://scholarworks.sjsu.edu/cgi/viewcontent.cgi?article=1662&context=etd_projects.

“Anaerobic Digestion.” Multi-Stage Anaerobic Digestion Facility - Quantum Biopower, www.quantumbiopower.com/clean-energy/anaerobic-digestion.html. Accessed 25 Nov. 2023.

Barrett, Julia R. “Compost: Your Trash, Nature’s Treasure!” American Chemical Society, Nov. 2017, www.acs.org/education/resources/highschool/chemmatters/past-issues/2017-2018/october2017/composting-your-trash-natures-treasure.html.

“Composting at Home | US EPA.” United States Environmental Protection Agency, US EPA, 14 June 2023, www.epa.gov/recycle/composting-home.

“Citizens Guide.” CT.Gov, portal.ct.gov/FOI/Quick-Links/Citizens-Guide.

“Connecticut Environmental Justice Mapping Tool.” ArcGIS Web Application, University of Connecticut, connecticut.maps.arcgis.com/apps/webappviewer/index.html?id=5adac07c27db40bbabc193af58634e5a. Accessed 25 Nov. 2023.

Corrin Barnes and Tegan Condon, "A Review of Municipal Compost Programs and Recommendations for the Town of Brookline, MA," Regulated Community Compliance Project, Boston University, Fall 2022, p. 3, www.bu.edu/rccp/files/2023/01/A-review-of-municipal-compost-programs-and-recommendations-for-the-Town-of-Brookline-MA.pdf.

“DEEP Announces 570,000 in Additional SMM Grants to Help Towns Reduce Waste and Save on Disposal Costs.” CT.Gov, Department of Energy & Environmental Protection, 9 May 2023, portal.ct.gov/DEEP/News-Releases/News-Releases---2023/DEEP-Announces-570000-in-Additional-SMM-Grants-to-Help-Towns-Reduce-Waste-and-Save-on-Disposal-Costs.

DEEP Announces Nearly 5 Million in Sustainable Materials Management Grant Awards.” CT.Gov, Department of Energy & Environmental Protection, 25 Oct. 2022, portal.ct.gov/DEEP/News-Releases/News-Releases---2022/DEEP-Announces-Nearly-5-Million-in-Sustainable-Materials-Management-Grant-Awards.

“How Does Anaerobic Digestion Work?” United States Environmental Protection Agency, US EPA, 9 Feb. 2023, www.epa.gov/agstar/how-does-anaerobic-digestion-work..

“National Overview: Facts and Figures on Materials, Wastes and Recycling ...” United States Environmental Protection Agency, www.epa.gov/facts-and-figures-about-materials-waste-and-recycling/national-overview-facts-and-figures-materials. Accessed 26 Nov. 2023.

“Organics Collection FAQs”, NYC Organics Collection, www.nyc.gov/html/mancb7/downloads/pdf/Organics_Collection-FAQs_citywide.pdf. Accessed 26 Nov. 2023.

Pinkerton, D. (2023, November 21). Biocycle nationwide survey: Residential Food Waste Collection Access in the U.S. BioCycle www.biocycle.net/residential-food-waste-collection-access-in-u-s/.

“Quantifying Methane Emissions from Landfilled Food Waste.” United States Environmental Protection Agency, www.epa.gov/land-research/quantifying-methane-emissions-landfilled-food-waste. Accessed 26 Nov. 2023.

Skahill, P. (2023, April 10). Out of the trash and saving cash. how food waste could transform New England’s garbage. Connecticut Public. www.ctpublic.org/news/2022-04-20/out-of-the-trash-saving-cash-how-food-waste-could-transform-new-englands-garbage.

Spiegel, Jan Ellen. “Legislature’s Inaction on Food Waste Leaves Municipalities to Pay.” CT Mirror, 21 June 2023, ctmirror.org/2023/06/21/ct-food-waste-disposal-cities-pay-funding-deep/?utm_source=Connecticut+Mirror+Mailing+List&utm_campaign=819ee7d54b-CT+Mirror+Morning+Briefing&utm_medium=email&utm_term=0_571d22f8e4-819ee7d54b-65937485&mc_cid=819ee7d54b&mc_eid=2d95c35aa0.

“Sustainable Materials Management (SMM) Grant Program update” Department of Energy & Environmental Protection, Presented 23 Oct. 2023. Shared via email 7 December 2023.

“We Are in a Waste Crisis.” ArcGIS StoryMaps, Naugatuck Valley Council of Governments (NVCOG), 12 July 2023, storymaps.arcgis.com/stories/be24e917780f42909ddb3248384a2b90.