College Interruption Rates and Their Effect on Hartford Promise Students

by Conor Bradley and Garrett Kirk

Last updated on December 8, 2023

for Data Visualization for All
with Prof. Jack Dougherty
Trinity College, Hartford CT, USA

Introduction

Impact of continuous versus interrupted enrollment on successful completion

Hartford Promise, is a Connecticut-based scholarship program that offers college students up to $5,000 per academic year. To qualify for the Hartford Promise scholarship, an individual must have gone to a Hartford public high school for their entire high school tenure, be a Hartford resident, attend at least 93% of their high school classes, and have at least a 3.0 GPA. We are tasked with investigating whether there are differences in graduation rates among students who are continuous enrollees versus interrupted enrollees. Furthermore, we sought to look at these rates while taking into consideration the gender and racial/ethnicity of students.

We define a continuous enrollment student as someone who does not take any fall or spring semesters off. We define an interrupted enrollment student as someone who takes at least one fall or spring semester off but eventually returns to college. If a student completes an associate's degree and then transfers to a four-year school, we do not consider that to be an interruption. If a student completes their fall semester, does not take a winter semester course, and then completes a spring semester, we do not consider that an interruption either. If a student completes their spring semester, does not take a summer semester course, and then completes a fall semester, we do not consider that an interruption.

Similarly, it is useful to clarify how we calculated our interruptions, and what is meant by the term we frequently use throughout our data that we call “interruption rate”. For example, we found that there was a 17% interruption rate among men. Under the methodology we used, this does not mean that 17 percent of the men in the Hartford Promise data set experienced interruptions. Instead, we divided the total number of interruptions that occurred among men (13) by the total number of men in our Hartford Promise Data set (76), and the corresponding percentage is 17. This means that the 13 interruptions we found do not necessarily mean that 13 men from the HP data set experienced interruptions, but instead mean that there were 13 total interruptions among the 76 men. We thought that measuring interruptions in this way would create a more meaningful picture of the experiences of students in the Hartford Promise data set, since there are individuals who experience multiple interruptions during their college tenure, and we wanted to ensure that this story was being told.

Hartford Promise might be interested in looking at the graduation rates between continuous versus interrupted enrollees so that they can take proactive measures to serve the groups of scholarship recipients who are statistically least likely to finish their studies. It appears on Hartford Promise’s website that they offer reactive support to scholarship recipients who are having difficulties succeeding academically, as their website states “If you find yourself on academic probation, please reach out to us! This may be hard for you to do, but you need a plan and support. We can be incredibly helpful!” . This type of support is reactive in nature, because Hartford Promise waits until a roadblock occurs to step in and offer its services. Hartford Promise may be looking to find ways to step in before students face difficulties, and in order to offer such proactive support they could be looking to see which students are statistically most likely to fall through the cracks. By having more comprehensive data about the impact interruptions have on graduation rates and which groups are most likely to have interruptions, Hartford Promise will be better equipped to establish more extensive safeguards to aid these scholarship recipients. We found that uninterrupted students from the Hartford Promise data set are 57 percent more likely to graduate than their interrupted counterparts. We noticed only modest discrepancies in the interruption rate among students with respect to gender and race/ethnicity.

Findings

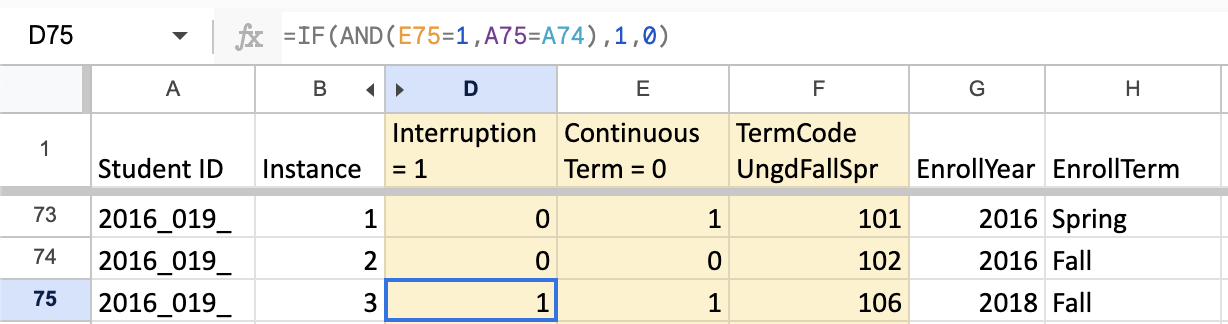
In Figure 1 we see the percent of Hartford Promise students who earned degrees in relation to whether or not they are interrupted or uninterrupted degree candidates. As the chart shows, the data is greatly skewed to favor the uninterrupted students, 59 percent of those who started their degree ended up finishing it, compared to 2 percent of interrupted students who finished their degree.

Figure 1. The Difference in Graduation Rates Among Interrupted Versus Uninterrupted Hartford Prokmise Students

This figure is significant because it demonstrates that if a student from the Hartford Promise program takes time off from college this statistically severely diminishes their probability of graduating.

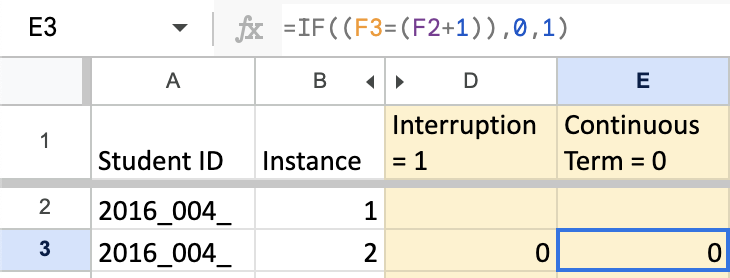
Figure 2 shows the racial/ethnic difference in interruption rate, with Asian students in the aggregate having an interruption rate of 18 percent, Black students having an interruption rate of 21 percent, Hispanic students having an interruption rate of 17 percent, and White students having an interruption rate of 0 percent. A similar principle is mobilized in this section as occurred in Figure 1, namely the notion that these percentages do not mean that, for example, 18 percent of all Asian students were interrupted in their degree attempt, since some students often were interrupted multiple times.

Figure 2. The Interruption Rates Among Black, Asian, Hispanic, and White Hartford Promise Students.

This information may be significant to Hartford Promise so they can tailor their scholarship program to support different cohorts of the population in order to ensure that there is greater parity among interruption rates with respect to different racial/ethnic backgrounds.

In Figure 3, we see that when comparing interruptions by gender, we found female students experienced a 22 percent interruption rate gap compared with 17 percent of Hartford Promise male students.On the other hand, we see that interruptions among Hartford Promise students occurred slightly less among men, at a rate of 17 percent of the 76 total men in the study. It is important to know that there are students in the data set who had multiple interruptions, so this data show not be construed as saying that 22 percent of the women had interruptions. For example, Student 2016_062 took time off after their 2020 fall semester, not returning to college until Fall 2021, and then this student also experienced an interruption after the Spring 2022 semester, not enrolling in college until Spring 2023. Similarly, student 2016_085 took time off after the Fall 2018 semester, returning to college in Fall 2020, and then took time off in Spring 2021, returning to college in Fall of 2022.

Figure 3. The Interruption Rates Among Men and Women in the Hartford Promise Data.

We see this data reflecting that there is only a modest difference in interruption frequency among genders in the Hartford Promise program, which in many ways defies conventional wisdom since women tend to have more success academically than men in grades K-12 as represented by grade point average (Damour; Gnaulati). One would traditionally think that the interruption rate would be higher among men in the Hartford Promise data set, but it is actually higher among women in the Hartford Promise data set, as this data shows.

These findings are significant because although there is only a slight difference between interruption percentages among these two genders, Hartford Promise may find it valuable to know about this slight discrepancy so that they can build a network of proactive support to ensure that the interruption percentage among women more closely aligns with that of men.

Methods

In order to analyze our data, our instructor helped us to create new columns in the spreadsheet data sheet using google sheets syntax that would calculate the number of interruptions among students in addition to the number of continuous terms that students accomplished.

Image 1: This image shows an example of how the 'interruption' column works.

The above image shows a formula that inputs a 1 whenever there is an interruption among Hartford Promise students. The code will recognize an interruptiuon if BOTH the 'student ID' (column A) is the same as previous one in the same column, AND the 'term code' (column F) is not consecutive.

Image 2: This image shows an example of how the 'continuous term' column works.

A continuous term is recognized in column E. A continuous term is recognized by a ‘0’, a ‘1’ will be present if it is a student’s first term enrolled, or first term after a break in enrollment. The hesitations we have regarding our data is that certain columns were deleted that were present in the original Hartford promise data, and therefore there exists a slight asymmetry among the results of our spreadsheet data and the data we were initially given.

Sources

Damour, Lisa. “Why Girls Beat Boys at School and Lose to Them at the Office.” NYTimes, New York Times, 7 Feb. 2019,www.nytimes.com/2019/02/07/opinion/sunday/girls-school-confidence.html.

Gnaulati, Enrico. “Why Girls Tend to Get Better Grades than Boys Do.” The Atlantic, Atlantic Media Company, 23 Sept. 2014, www.theatlantic.com/education/archive/2014/09/why-girls-get-better-grades-than-boys-do/380318/..

“The Scholarship.” HARTFORD PROMISE, www.hartfordpromise.org/thescholarship.html. Accessed 4 Dec. 2023.