Analyzing The Impact of Hartford's Traffic Calming Installations

by Keelyn McNamara

Last updated on May 1, 2023

Independent Data Visualization Study
with Prof. Jack Dougherty
Trinity College, Hartford CT, USA

Introduction

Is Traffic Calming Infrastructure Working for Hartford?

The city of Hartford has been installing new speed humps and other traffic calming measures around the city since 2018 as a way to slow down drivers and make the roadways safer (Putterman). Flatbush Avenue, a major roadway leading from Frog Hollow to West Hartford had speed humps installed in September of 2018 (Yi). The frog hollow neighborhood has also seen an influx of white plastic posts known as traffic delineators or city posts (Putterman). Lawrence Street, Wethersfield Avenue as well as the section of New Britain Avenue that surrounds Trinity College’s south side of campus had traffic delineators installed (Putterman). These recent installations on New Britain came after the tragic death of Jillian Hegarty who was a beloved student at Trinity College. She was unfortunately hit at the intersection between New Britain and Henry Street. With the installation of two types of traffic safety infrastructure around Hartford it is imperative to analyze if crashes have decreased on these heavily traveled road ways. This allows for a deeper understanding of the relationship between traffic calming installments and the number of crashes occuring. While there is more data for Flatbush Avenue due to a longer existance of speed humps it is imperative to begin early stages of research into New Britain. With an early look into New Britain, the methodology for further data analysis can be configured and confirmed. As someone who lives in Harford several months out of the year, I travel on these roadways frequently by both car and foot. The safety of Hartford residents has led me to explore if there is a relationship between crash rates before and after the traffic calming measures were installed in Flatbush and New Britain.

After conducting this crash data analysis using data from UCONN crash repository , Flatbush and New Britain experienced significant decreases in crash counts after the infrastructure was installed. Flatbush Avenue with 2 years worth of data experienced a 27% decrease in crash counts while New Britain experienced a 69% decrease with 7 months of data. This drastic New Britain decrease is not supported with an abundance of data so further analysis will be needed to confirm the traffic delineators effectiveness. Based on findings from this research, the traffic calming infrastructure has contributed to the decrease in crashes but other external and environmental factors may have also played a role in this decrease.

Flatbush Avenue Speed Hump Analysis

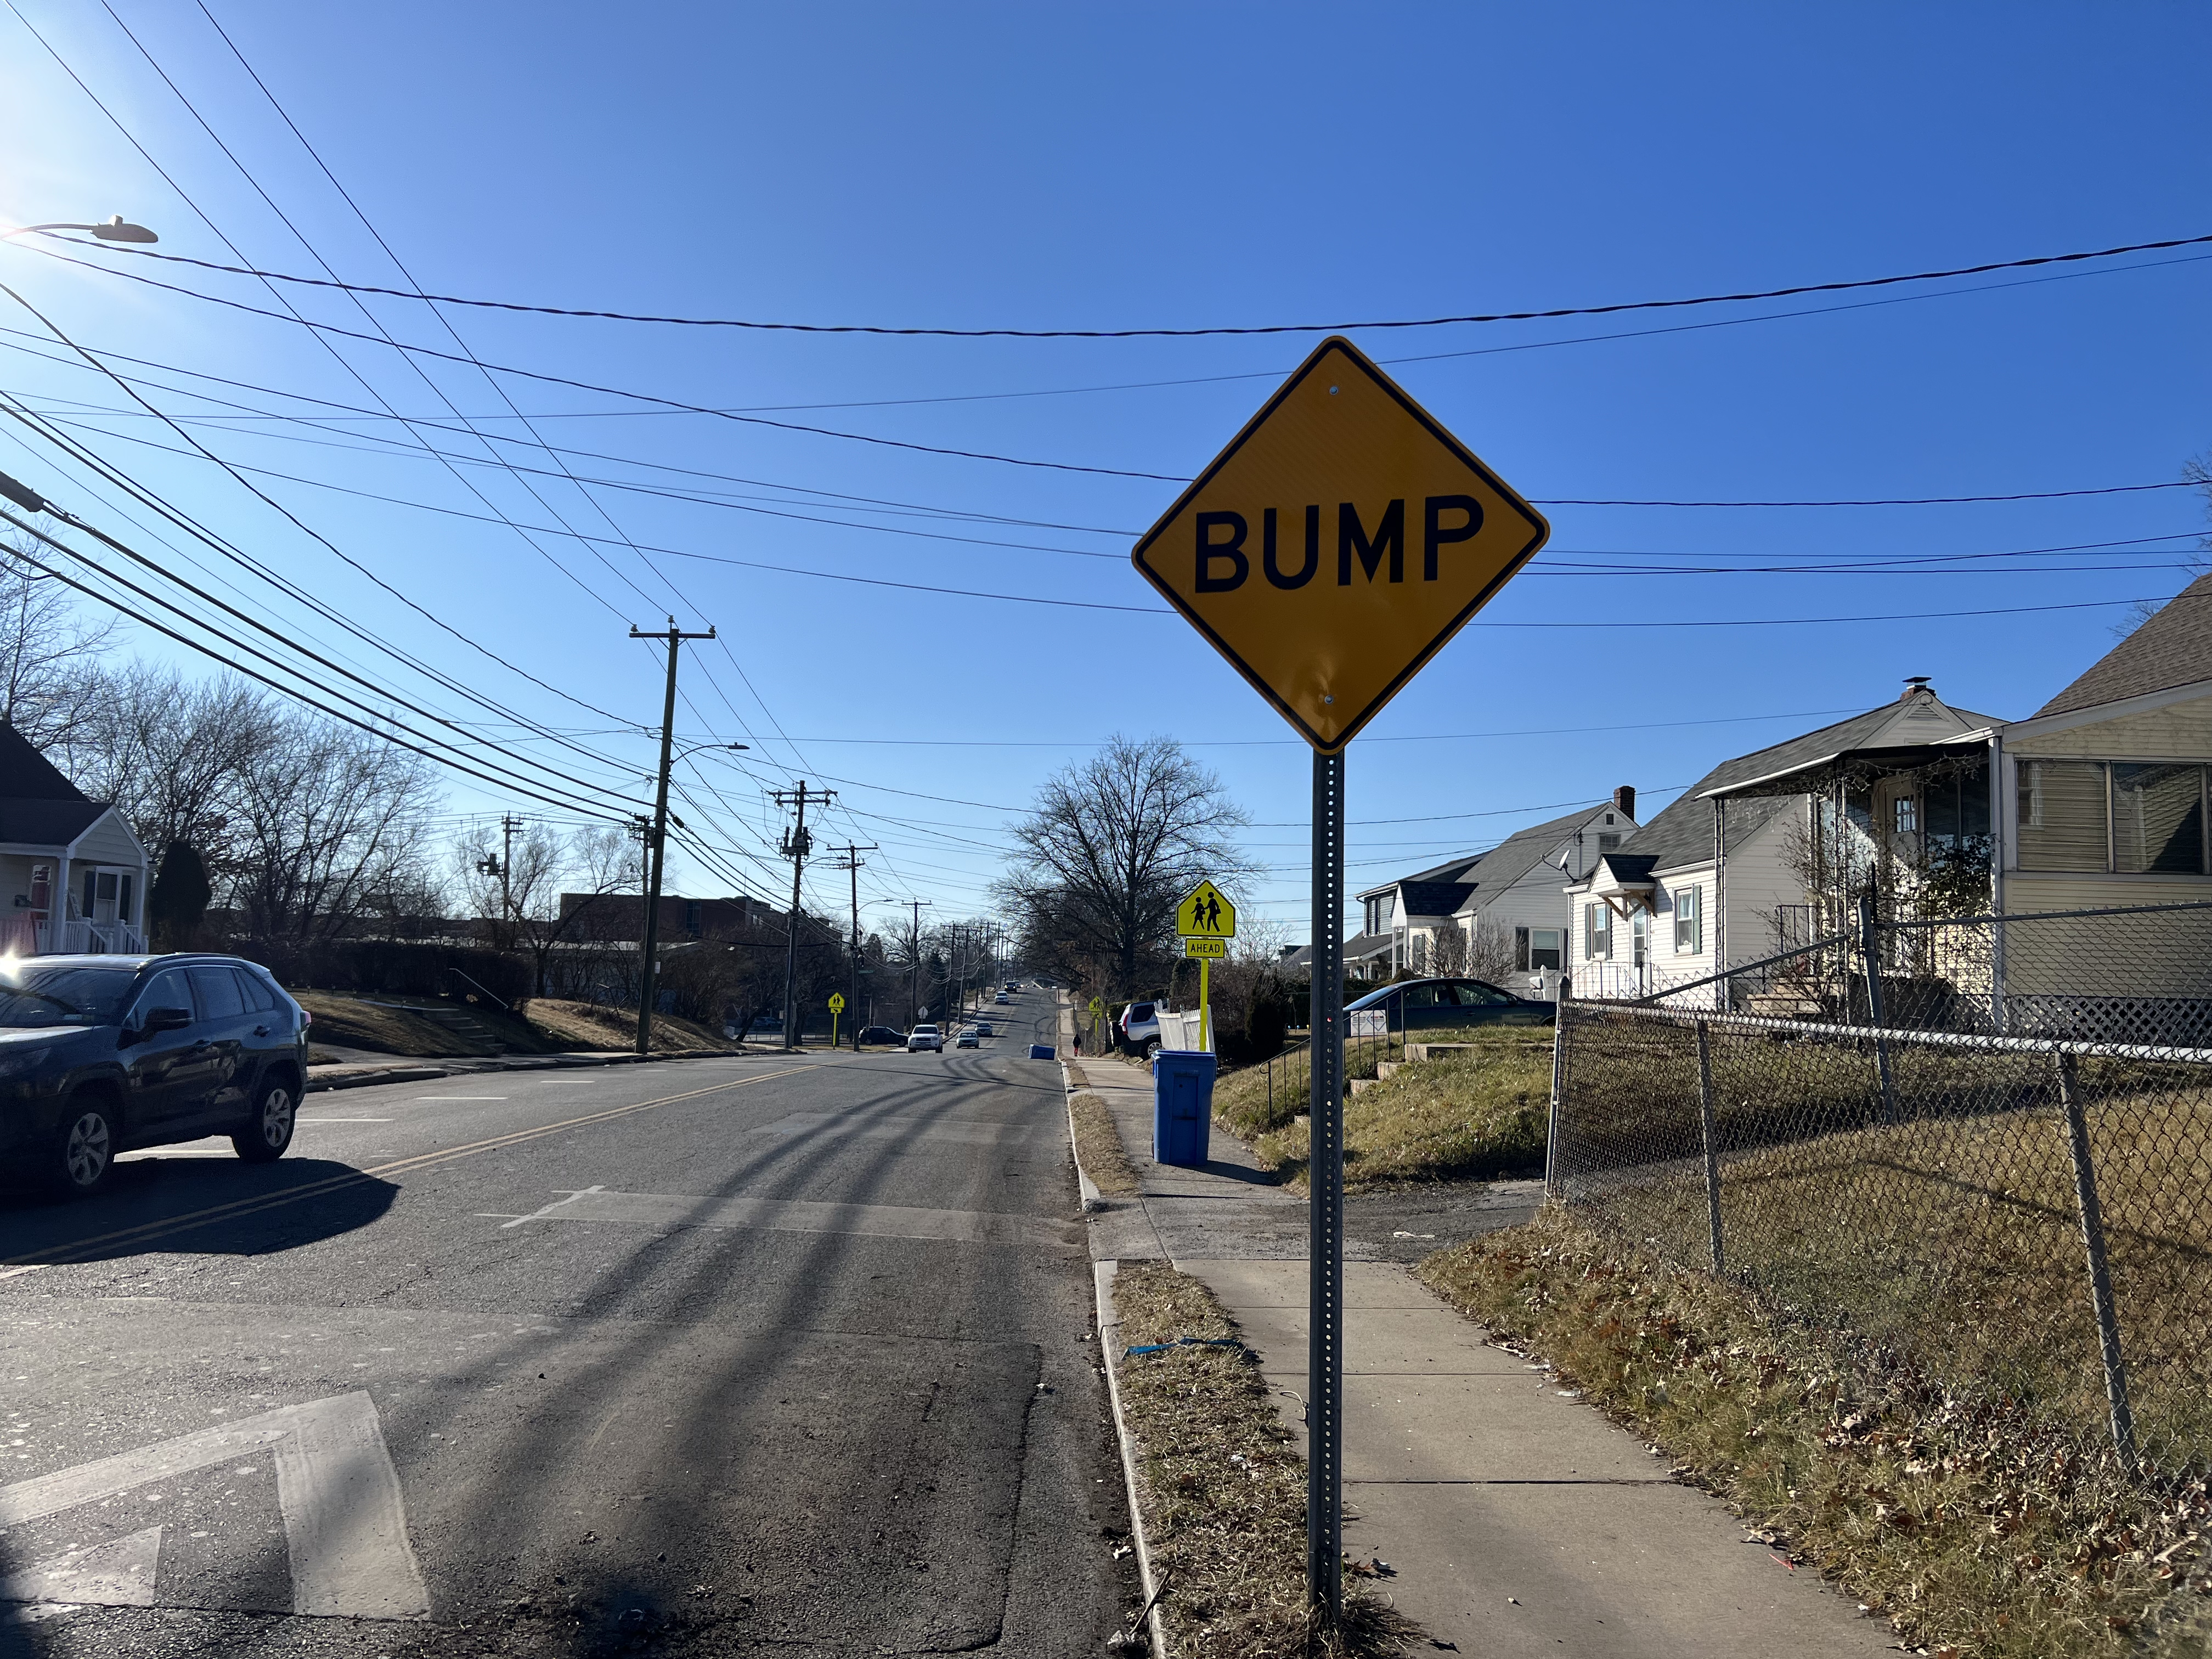
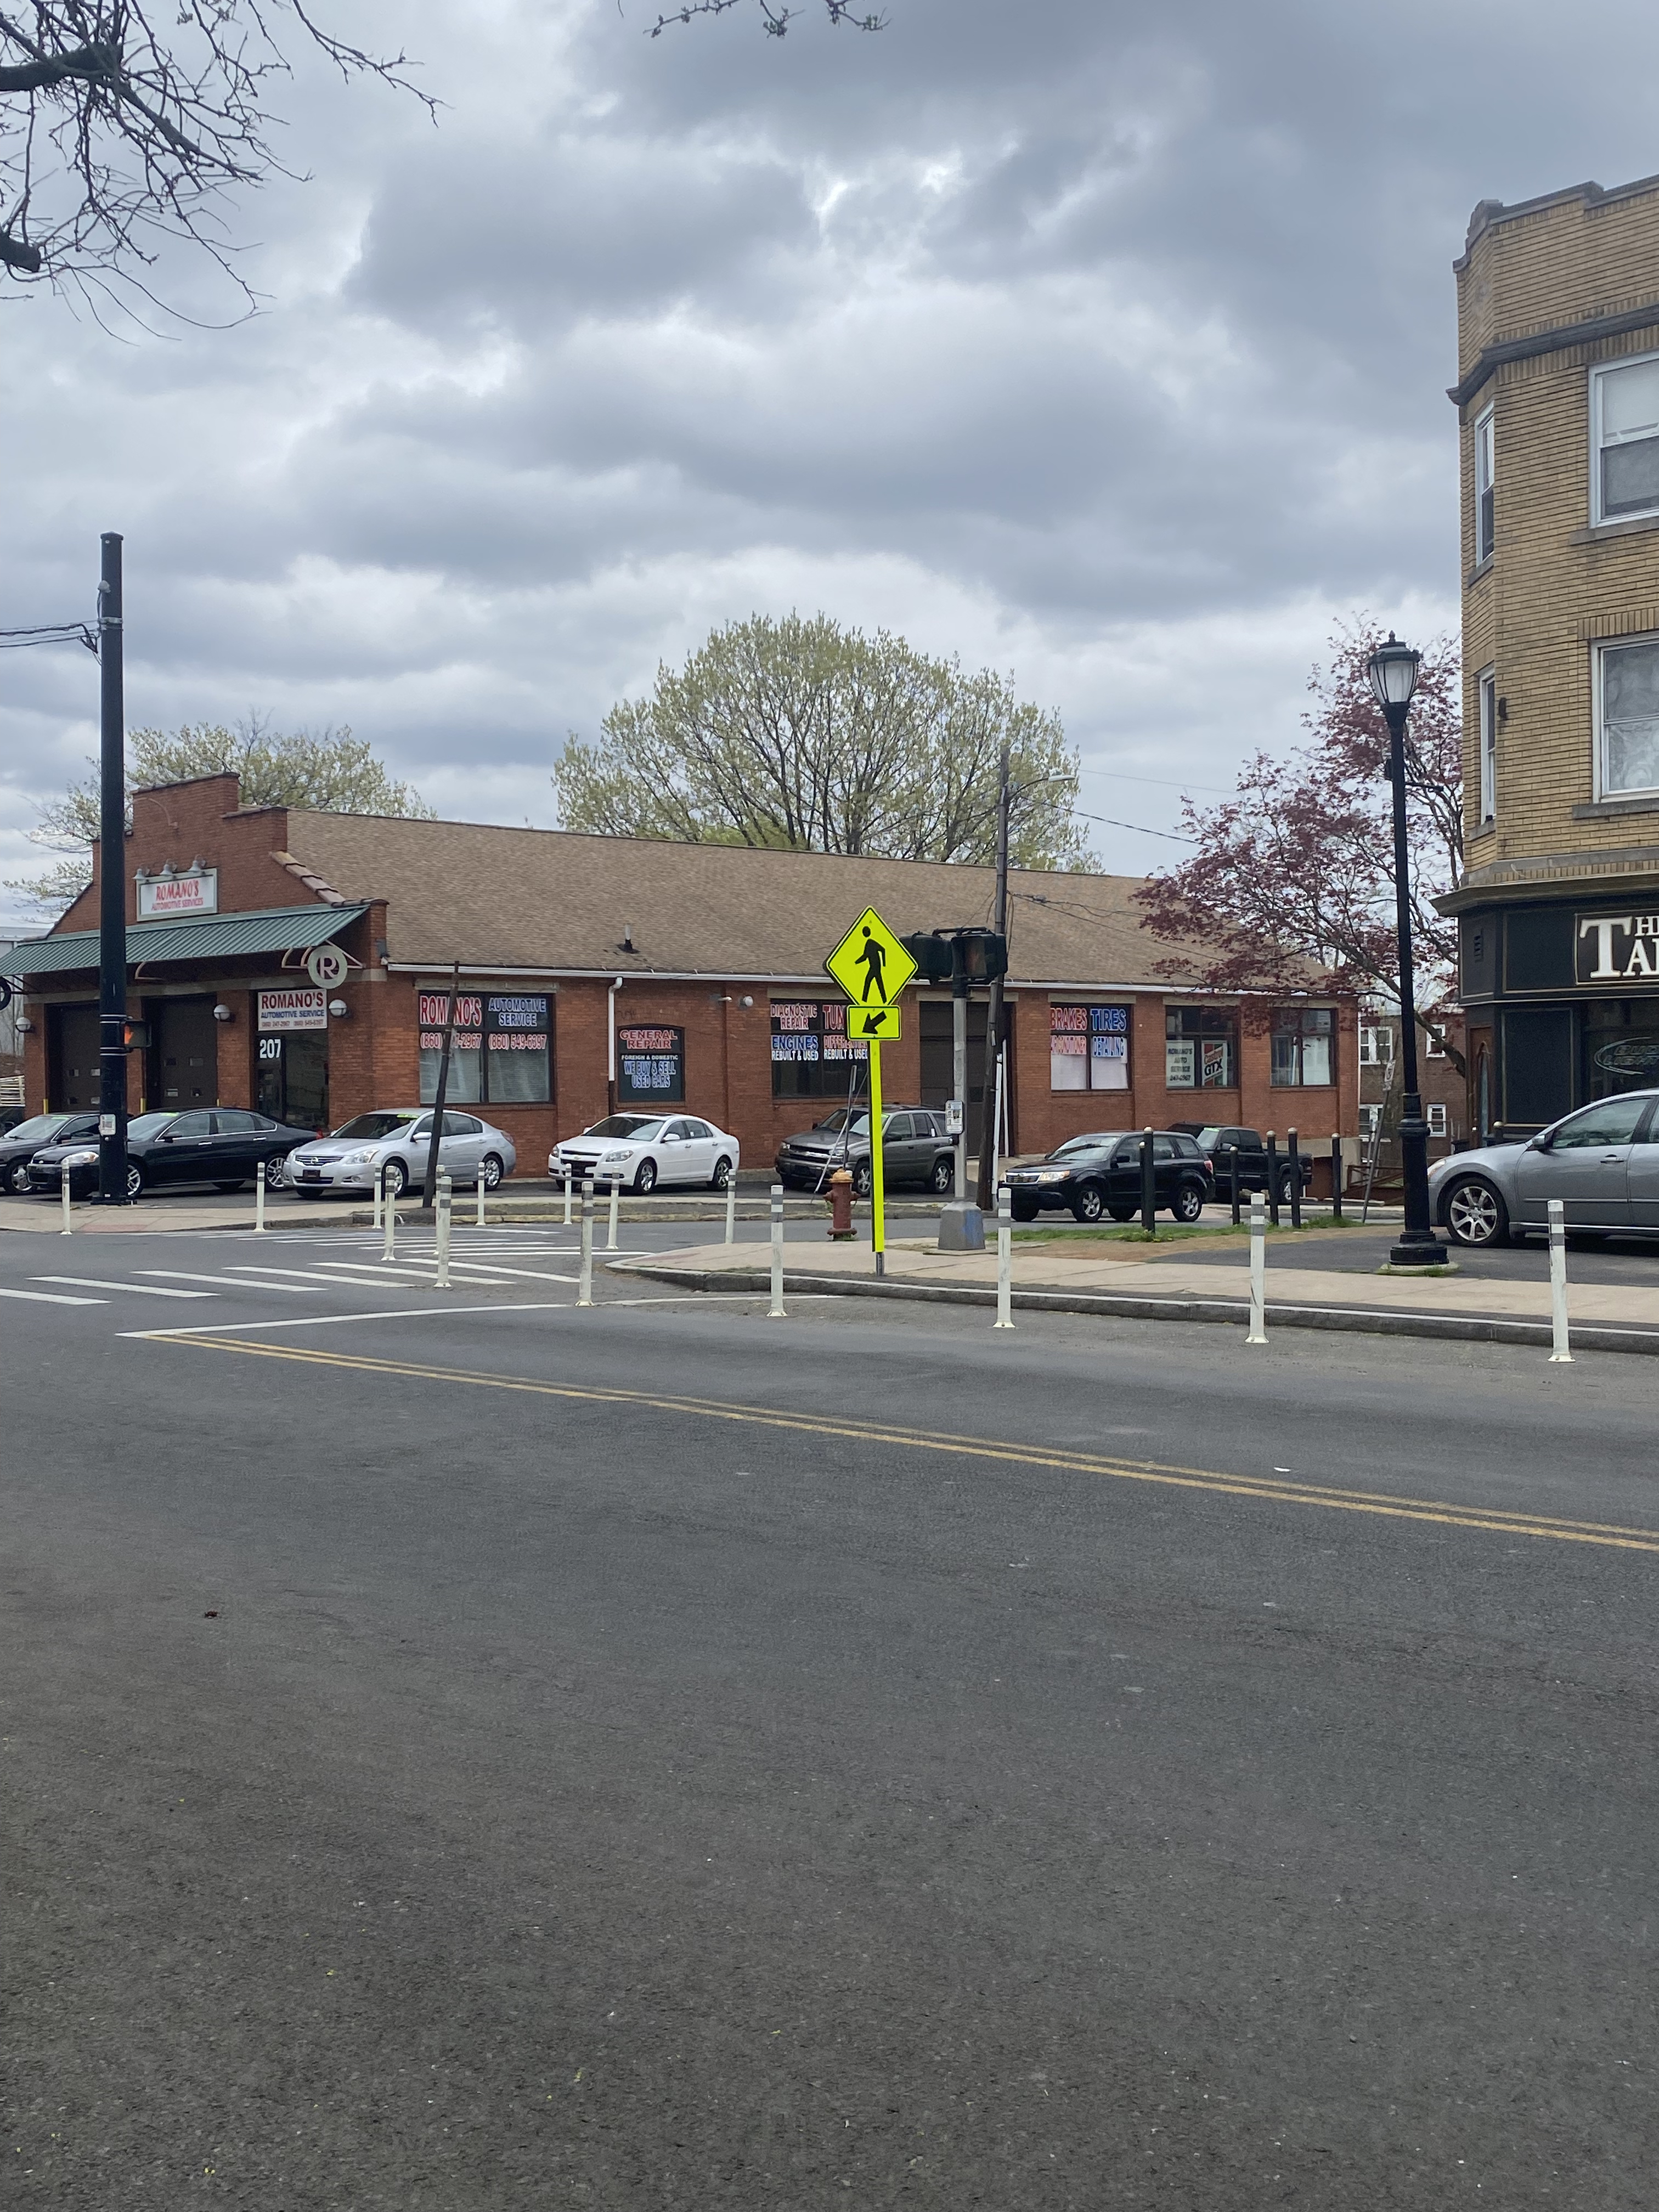
Photos of speed humps on Flatbush Avenue taken in Feburary of 2023. | Photo credit: Jack Dougherty

Flatbush Avenue is one of Hartford's major roadways that brings commuters from Hartford to West Hartford. Flatbush is a multifuncational roadway, with commuters using it to get on I-84 as well as residents using it to get to their homes and neighborhoods. Several large commercial stores are located on Flatbush as well, adding to the congestion of cars, shoppers and pedestrians that use Flatbush Avenue. Rubber speed humps were installed on Flatbush's eastern side as that section is mainly residential (Yi). These rubber and asphalt speed humps were a part of Hartford's initiative to increase traffic safety around the city especially in residential areas (Stannard). These rubber speed humps were installed in September of 2018 and in October of 2021 were finalized in asphalt (Yi). It is important to note that before being finalized in asphalt, the rubber speed humps were actually taken out in the winter months of 2020 spanning into 2021 (Yi). Unfortunately, it is unclear what exact months these rubber humps were taken out and put back. To migitate confusion and inaccuracy of when speed humps were put back in, these grey area months are included in the post-installation date range. This means that a few months of the post-installation data may have not had speed humps at all. More on this rationale can be found in the Process and Cautions Section. With over 2 years of recorded UCONN crash repository data from post speed hump installation, a crash count analysis can be done to observe crash counts have changed since installation. This analysis can provide the city of Hartford with viable data to help them better understand how these traffic calming measures are impacting the safety of citizens and if they are effective in increasing safety for all who use the roads.

Figure 1: Explore the interactive chart. View the Google data sheet. | The most recent Hartford crash data shows that Flatbush's crash counts decreased from the two years prior to installation compared to crash counts from two years after installation.

Flatbush Avenue had a total of 169 crashes in the two years (Sept. 2018 - Sept. 2020) before the four speed humps were installed. Four rubber speed humps were installed in September of 2020 and converted to more permanent asphalt humps in October of 2021. In the two years (October 2020 - Sep. 2022) after the speed humps were installed 122 crashes occurred. This equates to a -27.81% percent change in crash counts after the speed humps were installed. This can be compared to the control group, Hillside Avenue which has no speed humps and recorded significantly less total crashes than Flatbush. Hillside was found to have 75 crashes in the same two years before the Flatbush speed humps and 37 crashes in the two years after. This yields a large decrease of 50.67%. While Hillside and Flatbush are similar in location they may not have a similar number of crashes due to factors like differing roadway conditions, lighting or traffic patterns. Flatbush contains several large commercial stores that contribute greatly to the amount of people that use Flatbush to commute. Also with significantly lower crash rates, Hillside’s percent change is greatly affected by an individual crash more so than Flatbush.

Even though Flatbush did not experience the same drastic decrease as the control, Flatbush still recorded a significant decrease in crash counts. The decrease in crashes by 27% may be linked to the installation of the speed humps. It cannot be certain though that speed humps were the only reason for this decrease. Other external factors like differing winter conditions from year to year or changes in traffic flow may have also contributed to this decrease. While differing winter conditions may have had an impact on Flatbush’s crash count decrease, each time period had exactly two winters which is typically when a lot of crashes occur due to driving conditions. The seasons were equally distributed between each time period. The pre-installation dates also contain several months at which the pandemic was at its height (March 2020 - August 2020) which may have decreased total crash counts as less people were commuting to and from work. Also some of the post-install months did not conatin speed humps. This may have impacted the number of toal crashes for the post-install time period. With no traffic calming measures it is possible crashes were more likely to occur. Even with the traffic flow effects of Covid possibly lessening the crash counts of pre-install and a few months of no speed humps in the post-install, Flatbush still experienced a decrease from pre-install to post-install.

New Britain Traffic Traffic Delineator Analysis

Photos of traffic delineators and signage at New Britain Avenue and Henry Street intersection taken in April 2023. | Photo Credit: Keelyn McNamara

The section of New Britain that surrounds Trinity College’s southern side is congested and busy with students of all ages, residents and vehicles. New Britain is another main roadway in Hartford with several intersections, stores and residencies. It also is where the Koeppel Hockey Arena is located so it is frequently traveled by college students whether on foot or by car. This leads to a lot of pedestrians utilizing the crosswalks at the Crescent and Henry street intersections. With the tragic death of Jillian Hegarty, white posts (traffic delineators) were installed in the summer of 2022 at two intersections on New Britain Avenue (Lukaskiewicz). The traffic delineators (seen in image above) are located at the corners of where Crescent Street and Henry Street meet New Britain Avenue. These came as safety measures installed by the efforts of Trinity College in tandem with officials from the City of Hartford and Hartford Police Department (Lukaskiewicz). Trinity College's Dean of Community Life and Standards, Rob Lukaskiewicz, stated in a school-wide email that, "After the tragic death of Jillian Hegarty ’24 last spring, it has been a priority for us to work with the City Engineer and the Traffic Operations Engineer to plan and implement traffic-calming measures on streets adjacent to campus (Lukaskiewicz)." These delineators went up as a way to slow traffic and increase pedestrian safety. While these installments are recent to Hartford it is important to ensure that these installments are working the way they are intended. We must explore if there is a relationship between crash counts before and after installment to begin our safety evaluation of New Britain.

Figure 2: Explore the interactive chart View the Google data sheet. | An early 7 month analysis shows that after traffic delineators were installed, crash counts on New Britain Ave. have decreased significantly compared to same span of 7 months last year.

While the data is limited in range as the installation of the traffic delineators occurred last summer (August 2022) there are still some interesting findings that can be pulled from this preliminary research. These findings unfortunately may not carry much validity as the data sample is small and does not include summer months. The portion of New Britain Avenue that surrounds Trinity College experienced 13 crashes from September 2021 - April 2022. This is typically the time students are on campus. The following year during the same time frame (September 2022 - April 2023) the crash count for the same section of New Britain decreased to 4. This means that there was a 69% decrease in crashes from crashes last school year to this school year. The control group, Hillside Avenue, experienced a very consistent amount of crashes as the pre-installation months had 10 crashes and the post-installation months had 11 crashes. This control group had an increase of 10%. With the control group having a natural increase in crashes this really emphasizes the drastic decrease in crash counts on New Britain. While it may appear that the traffic delineators are directly correlating to this drastic decrease in crashes, the data sets are too small to confirm this. More time is needed to create a stronger data set and in turn a more valid case for the effectiveness of the traffic calming measures. It is great to see that crash counts have decreased but this is not enough data to confirm that this will continue to be the case. Summer months must be included to include all seasons. Several years of data post-installation will allow for a more accurate relationship to be observed.

Process and Cautions

Several steps were executed to analyze the crashes that occurred within each corridor. The methodology was repeated for each corridor using the same resources but differing time frames in data. The first decision that had to be made was deciding the time frames of pre-installation and post-installation. Since Flatbush Avenue installed temporary rubber speed bumps in September 2018 there was a wider range of data to be collected for pre speed humps and post speed humps. To gather the largest amount of crash data for this analysis, crashes 2 years previous to the speed humps were recorded as well as 2 years after. The decided date range for Flatbush Avenue was September 2018 - September 2020 for pre speed hump crash analysis and October 2020 - September 2022 for post speed hump crash analysis. These 2 year time chunks give an equal amount of seasons which is important to factor in as traffic flow patterns may change depending on environmental factors. It is important to note that according to City of Hartford Senior Planner Grace Yi, "temporary speed humps were removed before the winter of 2020/2021, so numbers may fluctuate during that time" (Yi). This temporary gap in speed hump installation during the winter of 2020 may have increased the possibility of crash counts for the post-install time frame as no traffic calming measures were in place. This decision to include the months of possibly no speed humps in the post-install time frame came out of the inability to pin point when the speed humps were put back in place. Without having a set post-install date to go off of and wanting to encompass the most amount of data possible it was decided that keeping those winter months in the data set was the best strategy. Even with this gap in speed hump installment, crash counts did decrease between pre- and post-install.

Unlike Flatbush Avenue, there is not a wide range of data that can be collected for previous and post traffic calming installation for New Britain Avenue. The traffic delineators were put in place by September 2022 so there is only a maximum 7 month range of data that can be collected. The date range for post traffic calming was September 2022 - April 7th 2023. Because this 7 month range does not expand over all seasons it was decided that the same 7 month period from a year ago would be used. This allows more normalization of data as these previous months would contain the same seasons as the post months. It is also important to note that the New Britain Avenue crash data post-install time frame may not have included all crashes. The UCONN crash data repository is continuously updated and sometimes crashes are uploaded days after they occur. The post-install data set may not be fully complete with all crashes as it included days close to the time frame of when this data analysis was done.

It is important to note that COVID-19 may have some effect on both Flatbush and New Britain's pre traffic calming installation crash counts. Traffic flow may have been minimized for the pre-installation time frame as less people were commuting to and from work during the height of the pandemic. With less cars on the road fewer accidents may have occurred. Even with this poetential minimization crash counts still decreased on both avenues. To minimize any disruption from external factors like COVID-19, Hillside Avenue crash counts were used as a control group. Hillside Avenue intersects with Flatbush going North and South. It does not have any new traffic calming installations and its traffic flow is presumed to be less than Flatbush. It was used as a control for both Flatbush and New Britain for their respective time frames.

Once time frames were selected for the corridors, Placemark.io was used to draw geojson corridors that encompassed both lanes of traffic for each avenue as well as intersections with other roads. The geojson corrdiors can be viewed here: Flatbush, New Britain, Hillside. The corridors can be seen below encompassing most of the crashes that occurred. The crash coordinates were found using data from UCONN crash repository . It is impossible to be exact with capturing all the crashes that occurred on the avenues. Faulty coordinates can show crashes that occurred in driveways or on side streets instead of happening on the actual street. A large majority of the crashes that occurred around the avenues and at intersections of the avenues were captured. The corridors were each 10 meters wide allowing for the tops of side streets to be included in the corridors. The corridor for Flatbush was one mile long and New Britain was shorter at .3 miles long. The control corridor of Hillside was in the middle of the two at .7 miles. Each of the corridors were applied to the crash points for each pre- and post-install time frame to see which crashes occurred within each corridor. Mapshaper was used for this joining of corridors to points. Once the specific crashes in each corridor were found they were counted for their time frame. The percent change between the pre and post crash counts was found to analyze the differences.

Photo on the left is the geojson used to define the Flatbush Corridor with pre-install crash data. Photo on the right is the geojson used to define the New Britain Corridor with pre-install data | Photo Credit: Placemark.io Screen Capture

Concluding Thoughts

At the heart of this data story is the question, "Is New Traffic Calming Infrastructure Increasing Safety for Hartford"? While this is a broad question, it is an important one as it addresses the safety of commuters. It is imperative after Hartford’s traffic calming initiatives to really see if Hartford streets are getting safer to walk, ride and drive on. An added bonus to analyzing two corridors located in close proximity to Trinity’s Campus, is that student safety can also be considered. In analyzing the data available for both Flatbush and New Britain Avenue, significant decreases in crash counts can be observed in both corridors. While Flatbush did not drastically decrease like the control, Hillside Avenue, it did record a 27% decrease (47 less crashes) in the two years after the speed humps went in. It can be assumed that the speed humps have helped aid in this decrease. New Britain has seen a drastic decrease in crashes (69%) but this was only with preliminary data. While a very promising start, more data will be needed to solidify this New Britain Avenue result. Overall there does appear to be a fairly definitive relationship between decreasing crash counts and installation of traffic calming measures. This is showing that Hartford's traffic calming measures are so far successful in their goal of making roadways safer.

Bibliography

Dylan, Jonah. “These Are Hartford’s 10 Most Dangerous Intersections, Data Shows.” Hartford Courant, 16 Jan. 2023, https://www.ctinsider.com/news/article/Hartford-dangerous-intersections-crashes-17716677.php.

Korfonta, Melina. “Office of Campus Safety Addresses Traffic Concerns.” Trinity Tripod, 13 Sept. 2022, https://tripod.domains.trincoll.edu/news/office-of-campus-safety-addresses-traffic-concerns/

Lukaskiewicz, Robert. Improvements to Address Traffic Concerns. Email. 29 Aug. 2022.

Putterman, Alex. “Can Hartford Slow Traffic, Make Neighborhoods More Pedestrian Friendly? Here’s What the City Is Trying.” Hartford Courant, 6 Apr. 2022, https://www.courant.com/2022/04/06can-hartford-slow-traffic-make-neighborhoods-more-pedestrian-friendly-heres-what-the-city-is-trying.

Stannard, Ed. “Here Are 10 Hartford Roads with the Most Crashes since 2020. With a Map That Shows Worst Spots.” Hartford Courant, 20 July 2022, https://www.courant.com/2022/07/18/here-are-10-hartford-roads-with-the-most-crashes-since-2020-with-a-map-that-shows-worst-spots/.

Yi, Grace. New Date for Pre-and Post-Installation on Flatbush Ave. Email. 20 Apr. 2023.

Yi, Grace, and Jack Dougherty. 2022 Hartford Speed Humps City Planning. 2 Mar. 2023, https://docs.google.com/spreadsheets/d/1ifhg0-YiDDEdgZHXZyXdfBVO2jRYDrMxTuslBFF-vJE/edit#gid=671425580.