Has the Installation of Speed Humps on Flatbush Avenue Affected Crash Data?

by Alison MacDougall & Caroline Lally

Last updated on 4/30/2023

for Data Visualization for All
with Prof. Jack Dougherty
Trinity College, Hartford CT, USA

Introduction

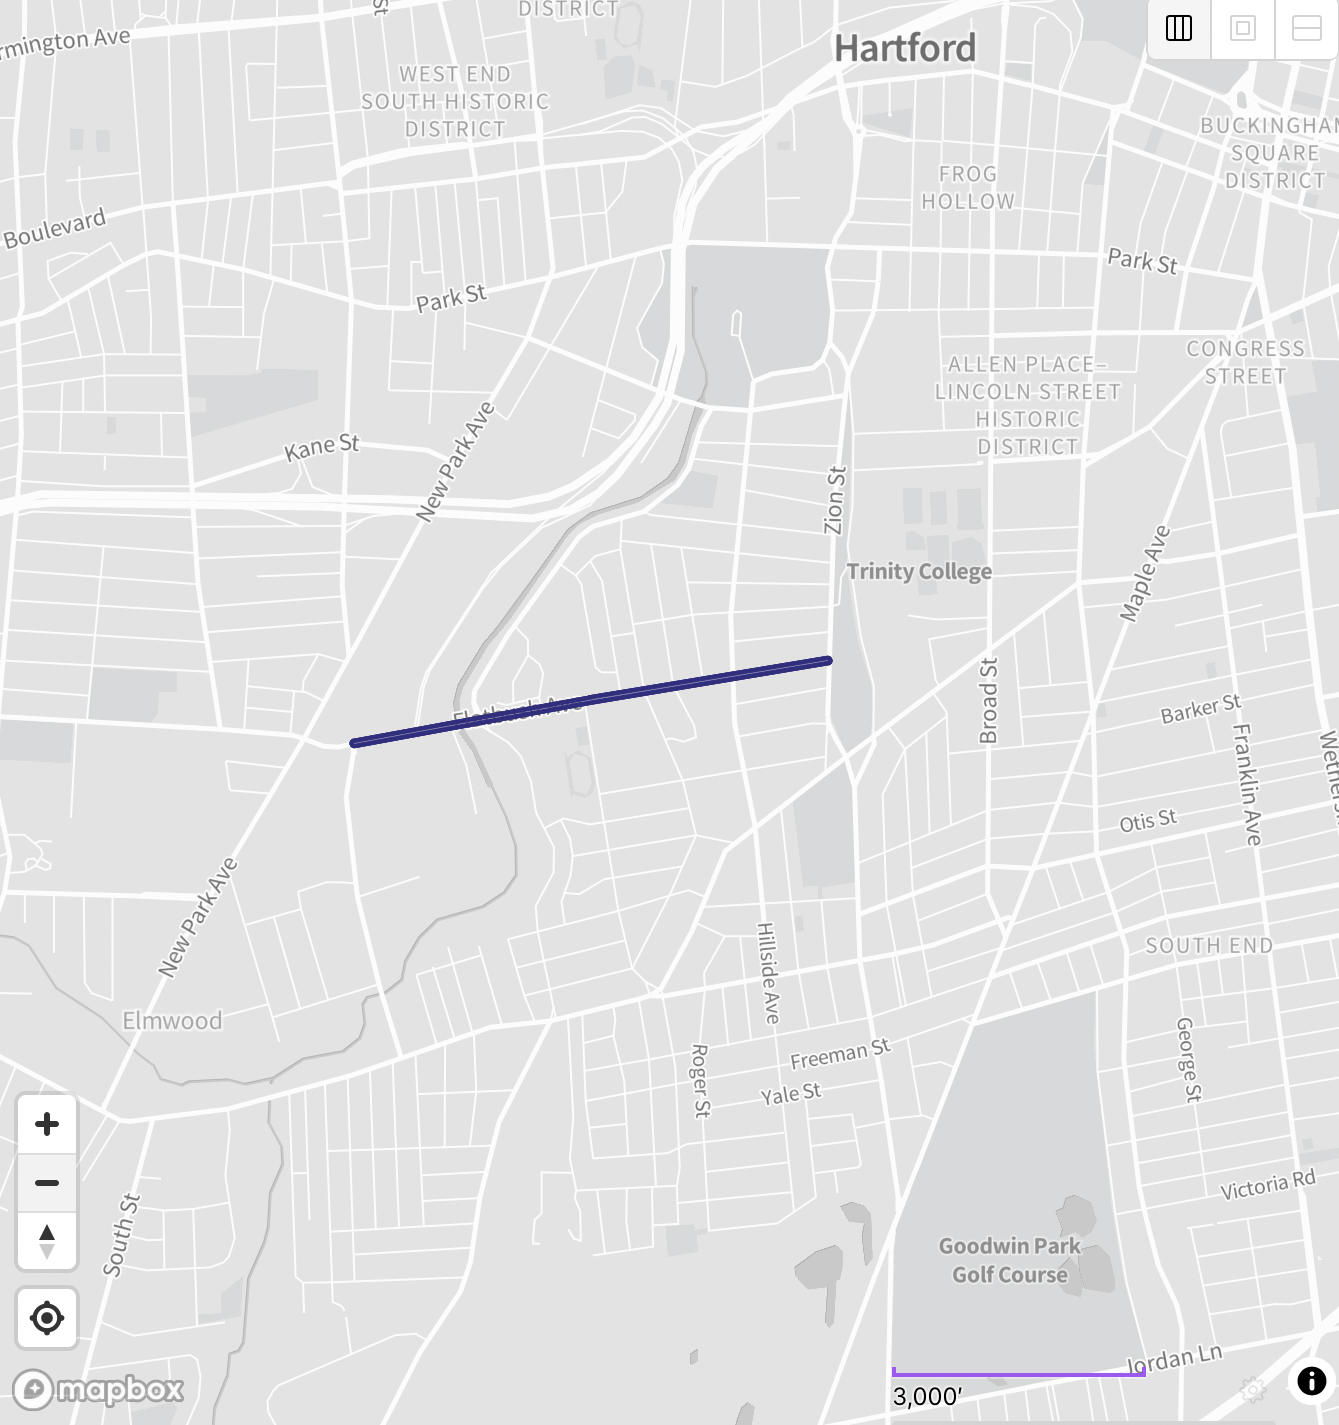
In September of 2020, the city of Hartford installed speed humps on Flatbush Avenue (see Figure 1), a corridor located a street over from Trinity College, in an attempt to reduce the number of crashes that were frequently occurring on the street. Speed humps are large, wide raised surfaces in roadways. They are a cost-effective traffic-calming measure that aims to slow down drivers, reduce the speed they are going, and consequently, reduce the number of crashes from high speed collisions. Local governments, like the city of Hartford, intentionally installed these humps in hopes that drivers would be more cautious when driving and make the city's streets more safe. This research was conducted to see the effectiveness of the speed humps and whether or not more should be installed on other busy streets in Hartford. These traffic-calming humps were also installed on other major streets surrounding Trinity College, including Summit Street, Allen Place, and Wethersfield Avenue.

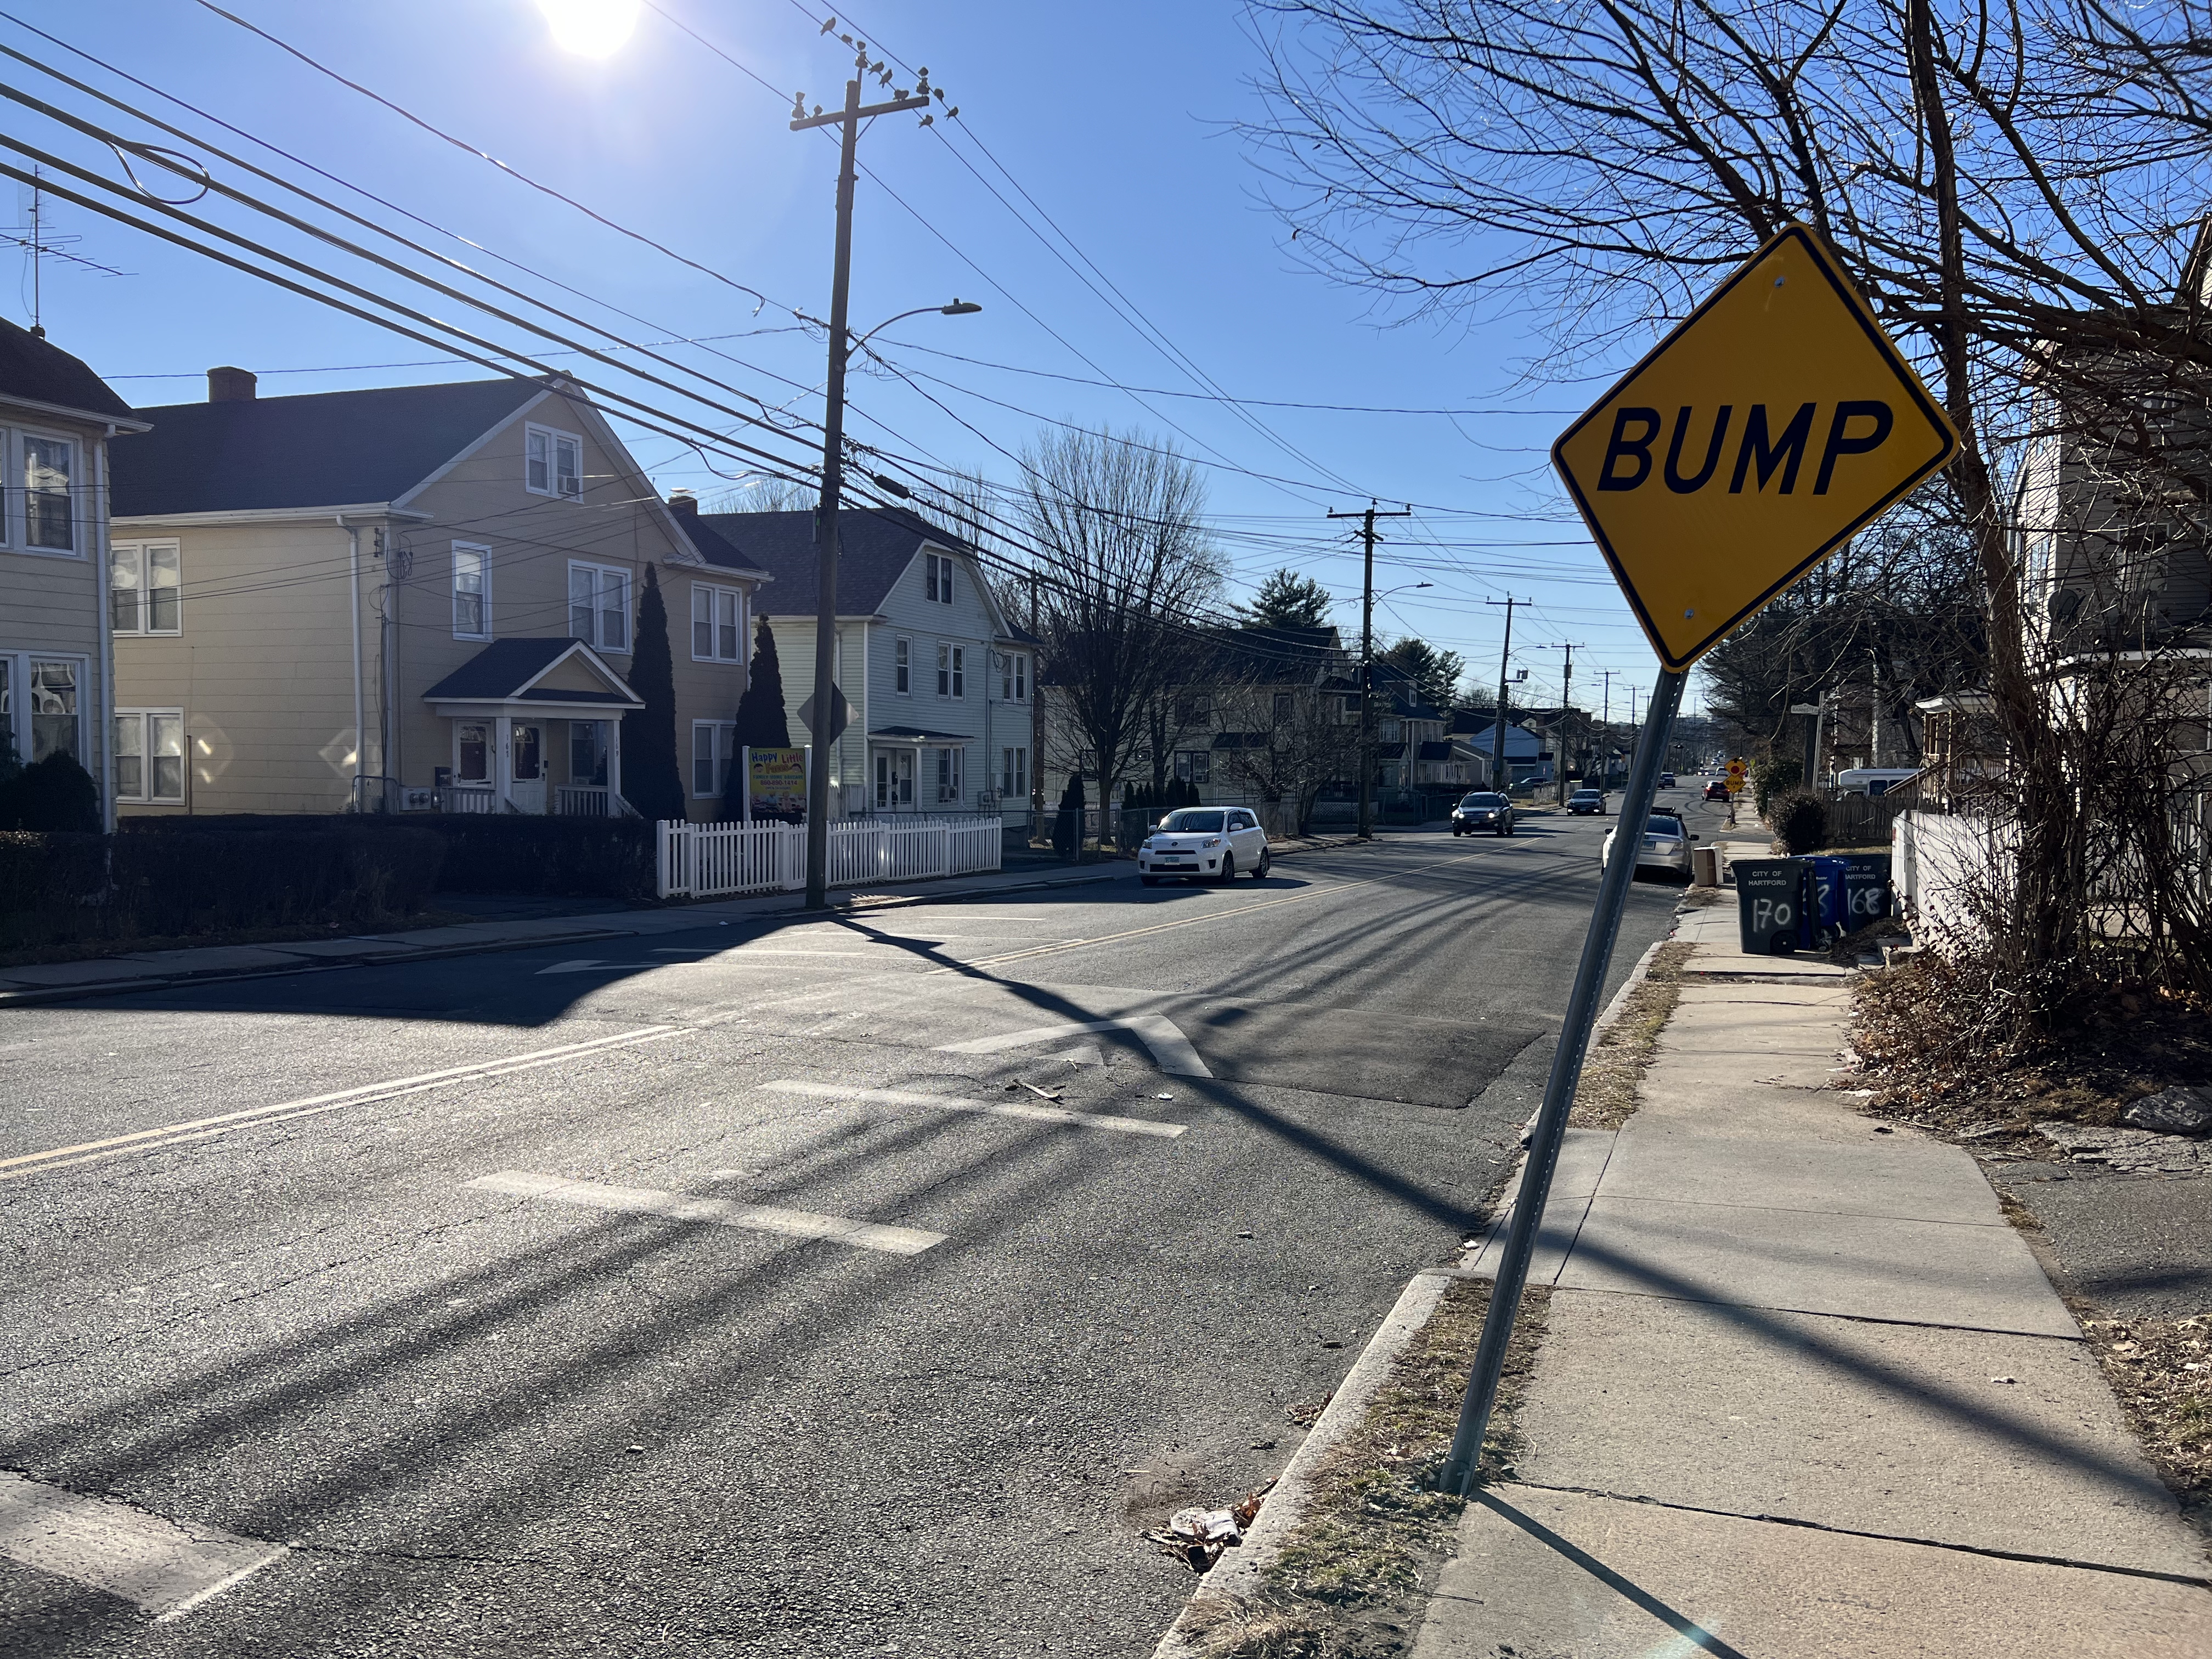
Figure 1: Picture of speed hump at 161 Flatbush Avenue, Hartford CT

We’ve chosen to analyze the speed humps on Flatbush Avenue due to the fact that they were installed the earliest, and therefore have the most data available. With Trinity being located in such a busy area, the safety and well-being of the students was also another push for installation of the humps, especially after the tragic death of a fellow student in March of 2022. Last March, a young girl and her two friends were struck by a fast-moving car on New Britain Avenue. Following the crash, the city also installed white bollards, a different type of traffic-calming measure, on New Britain Ave in an attempt to reduce the high number of crashes that had been occuring.

Currently, there is data on crashes that have occurred on Flatbush Avenue for up to 2 years before and after the installation, and the results are extremely helpful to the city of Hartford. Because the city of Hartford wants what is best for its people, it is important to ask the question, did crashes change after traffic-calming speed humps were installed on Flatbush Ave? To further determine short-term and long-term effectiveness, we will be analyzing this data from two different date ranges: 1 year pre and post speed hump installation, and 2 years pre and post speed hump installation.

Findings & Evidence

Before delving into our findings, it is important to note that the data showing the effectiveness of speed humps on Flatbush Avenue remains consistent across both time periods that we chose to examine. Our analysis focuses on the 1 year pre and post installation, as well as the 2 years pre and post installation, and regardless of which of these analyses you look at, the results tell the same story. As you will see below, the 1 year analysis shows an overall decrease in crashes and the 2 year analysis also shows an overall decrease in crashes. As you look at and analyze our findings in the following paragraphs and visuals, it is important to keep this in mind seeing as it hints to the larger, big-picture trend of our comprehensive data set.

1 Year Analysis

Figure 2: Crashes on Flatbush 1 Year Pre vs 1 Year Post Speed Hump Installation (interactive chart)

Based on the visualization above, we can see that in the year post installation of speed humps on Flatbush Avenue, crashes decrease. From September 2019 to September 2020, the year before the installation, there were 59 crashes. From October 2020 to September 2021, the year after the installation, there were 48 crashes. This decrease was a percent change of -18.64%. Based on this data, it would appear that the speed humps installed on Flatbush by the city of Hartford were effective at slowing down drivers and reducing crashes that occur short-term.

2 Year Analysis

Figure 3: Crashes on Flatbush 2 Years Pre vs 2 Years Post Speed Hump Installation (interactive chart)

Based on the visualization above, we can see that two years after the installation of traffic-calming speed humps, the number of crashes occurring on Flatbush Avenue decreased. Starting in September 2018, 2 years prior to the installation of the humps, and up until September 2020, there were 169 crashes. In the 2 years after installation, the number of crashes went from 169 to 121. This decrease in crashes was a percent change of -28.4%, which is a promising statistic for the city of Hartford. These numbers show that the speed humps have been successful in slowing drivers so that less crashes are occuring long-term. As a result of this, the city of Hartford should be encouraged to install more traffic-calming speed humps around the campus of Trinity College and the rest of the city.

Interpreting the Findings

Before delving into our analysis of this crash data, we should draw your attention to the fact that our chosen installation date of September 2020 is our best estimate and not a definite fact. Based on crash data from 2018-2022 and upon further investigation through talking with community partners at Hartford City Planning, we were able to uncover some information about when exactly speed humps were installed on Flatbush Avenue. We discovered that temporary rubber speed humps were installed in September of 2020 and then permanent ones were later installed in 2021. Unfortunately we were unable to get a specific date for when the temporary ones switched to permanent but, we decided to use September 2020 since there were still speed humps present in the Flatbush corridor which would’ve affected traffic to some degree.

Along with this uncertainty about the true installation date comes some obvious cautions to our data. Since the temporary speed humps were installed in September 2020, they were also removed at some point in winter of 2020-2021 before the permanent humps were installed later in 2021. This means that there was a period of time where there were no speed humps on the Flatbush corridor after our chosen installation date. Despite our best efforts, we were unable to uncover any more information about this and therefore decided to stick with September 2020 as our installation date since speed humps were present from this time on, at least to some extent, and were therefore influencing traffic and crash data. The consistent downward trend in crashes from our data and analysis would not suggest that this period of time where Flatbush Avenue was ‘missing’ speed humps after September 2020 had any affect on the crash data, but it is important to know that we cannot say that with absolute certainty.

Regardless, overall, from both the 1 year pre and post installation and the 2 year pre and post installation data sets, it is obvious that crashes on Flatbush Avenue significantly decreased following the installation of speed humps. Both short-term and long-term data shows that there are notably fewer crashes that have occurred. While we caution that there may be other factors that played a role in the decreased number of crashes on Flatbush, it is clear that the presence of speed humps greatly influenced this downward trend in the data.

Sources & Methods

Sources

In order to create our data story regarding the speed humps on Flatbush Avenue, we utilized many online sources and tools. First, we used Placemark.io to help us create the corridor that will determine which points/crashes to include in our data and eventually in our chart. Then, to collect data for our charts we used the UCONN Crash Data Repository to find all crash data in Hartford for 1 year before and after the speed humps were installed as well as for 2 years before and after the speed humps were installed. Finally, we used Map Shaper to join our corridor and our crash data all in one place so that we could visualize it. The last sources are our shared google sheet that contains data of the crashes that we obtained from the UCONN Crash Data Repository. There are two sheets: the first contains data of the 1 year pre and 1 year post installation and the second contains data of the 2 years pre and 2 years post installation. We also used Datawrapper to create our visualizations of the crash data (see figures 2 and 3).

Methods

To begin, we first needed to make a corridor around Flatbush Avenue to determine a radius that we can place and count the crash data in (see figure 4). To accomplish this, we used PlaceMark.io and created a line from the Walmart Supercenter on Flatbush Avenue to the intersection of Flatbush Avenue with Zion Street. We then buffered it and made the radius wider to create our corridor. After this, we compiled data of all crashes in Hartford using the UCONN Crash Data Repository from September 20218 (2 years prior to the speed hump installation) to September 2022 (2 years after the speed hump installation). We created two sets of data: one for the 1 year pre and post installation in September 2020 and another for 2 years pre and post installation in September 2020 in order to separate the data for our visualizations. After that, we used the Map Shaper platform to join the corridor with the points of data from the UCONN Crash Data Repository. After that we counted the points that fell in the Flatbush corridor for each set of data (counted the crashes for 1 year pre, 1 year post, 2 years pre and 2 years post). Finally, our last step was to find the percent change in crashes. So we found percent change from the 1 year pre installation to 1 year post installation and then we found percent change again from 2 years pre installation to 2 years post installation.

Figure 4: Flatbush corridor used for plotting and counting crash data on Flatbush Avenue. Includes Flatbush Avenue from the Walmart Supercenter to the intersection of Flatbush Avenue and Zion Street. Created using Placemark.io

Bibliography

Connecticut Crash Data Repository, https://www.ctcrash.uconn.edu/.

“Create Charts, Maps, and Tables.” Datawrapper, 2 Mar. 2023, https://www.datawrapper.de/.

Korfonta, Melina. “Office of Campus Safety Addresses Traffic Concerns.” Office of Campus Safety Addresses Traffic Concerns , The Trinity Tripod, 13 Sept. 2022, https://tripod.domains.trincoll.edu/news/office-of-campus-safety-addresses-traffic-concerns/.

“Mapshaper.” Mapshaper, https://mapshaper.org/.

Placemark, https://www.placemark.io/.

Putterman, Alex. “Can Hartford Slow Traffic, Make Neighborhoods More Pedestrian Friendly? Here's What the City Is Trying.” Hartford Courant, Hartford Courant, 6 Apr. 2022, https://www.courant.com/2022/04/06/can-hartford-slow-traffic-make-neighborhoods-more-pedestrian-friendly-heres-what-the-city-is-trying/.

Speed Hump on Flatbush Avenue Taken by Jack Dougherty. 8 Feb. 2023.