Story
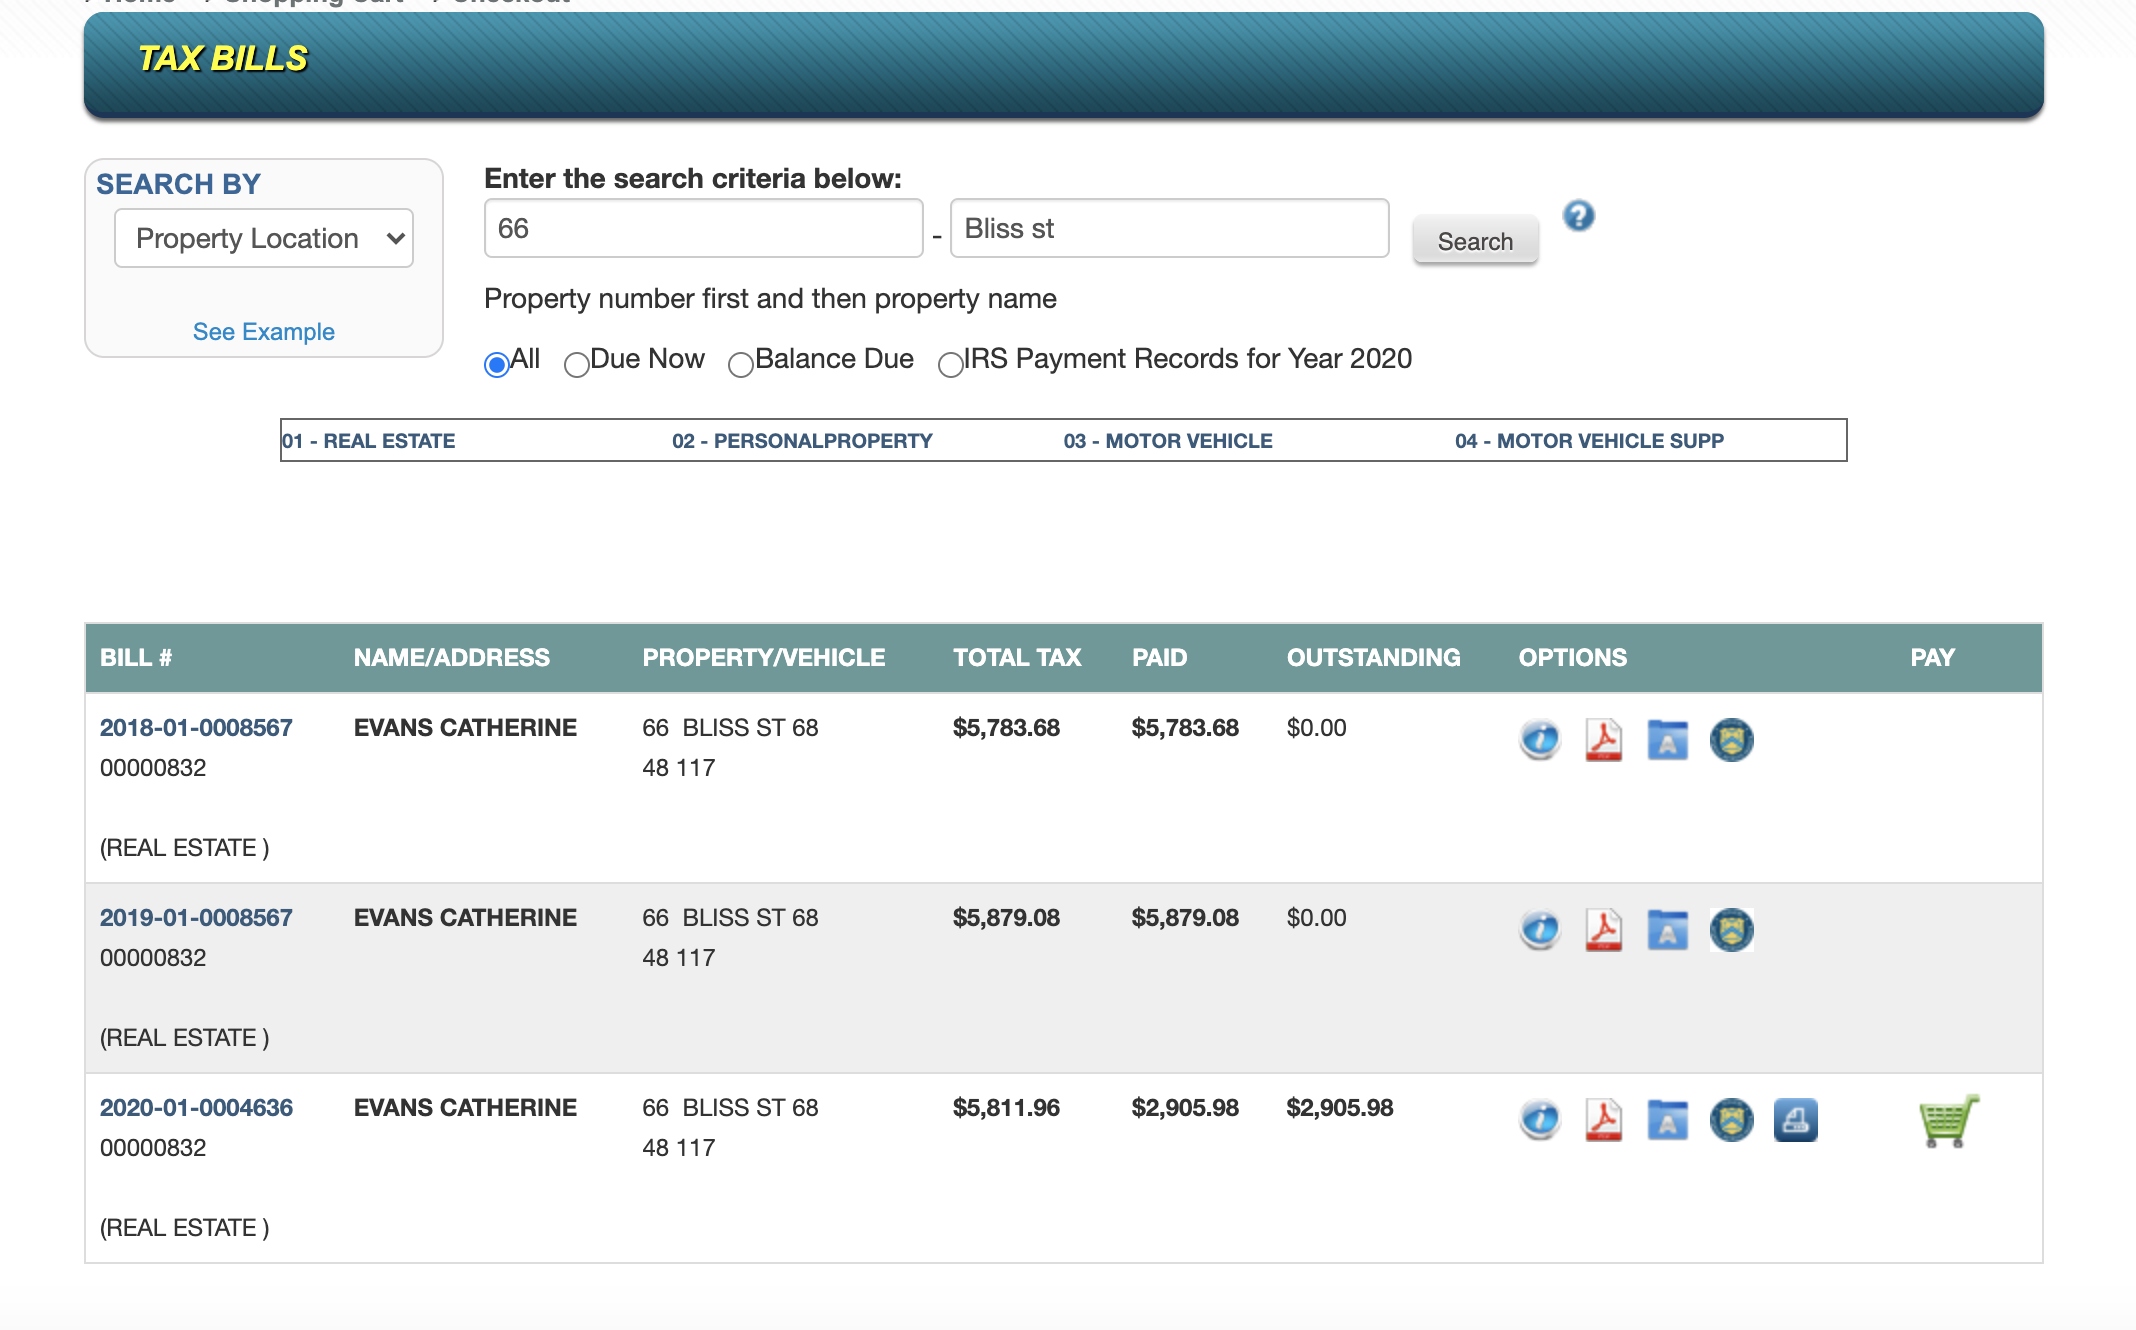
For my data build, I was tasked with finding out how much property tax revenue Hartford Area Habitat for Humanity homes generated for local governments in 2020.
Since 1989, Hartford Area Habitat for Humanity has been providing affordable and safe housing to local families through the construction of new homes or the renovation of old ones. To date, they have completed about 250 of these projects.
Finding information on how much property tax their builds have generated is important because it shows how along with helping out families by providing reliable housing, the organization also aids local governments by providing them with thousands of dollars in additional property taxes.
These property taxes often go back into the community by providing public education, improving infrastructure, and funding public safety, so any increase in them will help the community develop.
Most recently in 2020, I found that the organization’s 249 homes generated a total of $864,739 in total tax revenue for 11 different communities.
Hartford led the way with over $500,000 in property taxes generated by 178 homes, as can be seen in the chart here:
Figure 1: A chart showing how much property tax Hartford Habitat homes generated for each town they were built in. If the chart is not displayed, click here.
New Britain followed with over $100,000 generated by 24 homes. Additionally, Bloomfield and East Hartford both also generated almost $50,000 each, with 11 and 9 homes respectively.
Along with the $850,000 in property taxes, it is also impressive how many towns Hartford Area Habitat has built in, which is shown by the map below.
Figure 2: A map showing the locations of Hartford Habitat's homes and how much property tax they generated in 2020. If the map is not displayed, click here.
With this map, it’s easy to see the wide outreach that Hartford Area Habitat for Humanity has. In just 2020 alone, Hartford Habitat helped generate over $850,000 in property taxes for 11 different local governments.
This number will only continue to rise as Hartford Habitat continues to aid local communities with their builds.
| Town Name | Total Habitat Homes | Tax Revenue Generated by Habitat Homes (2020) |
|---|---|---|
| Hartford | 178 | $541,224 |
| New Britain | 24 | $116,170 |
| Bloomfield | 11 | $49,276 |
| East Hartford | 9 | $47,892 |
| Manchester | 6 | $27,939 |
| Vernon | 7 | $21,722 |
| Bristol | 6 | $20,223 |
| Glastonbury | 2 | $15,876 |
| Granby | 2 | $12,139 |
| Windsor | 2 | $7,258 |
| Farmington | 2 | $5,020 |
Figure 3: A table summarizing the data that was found.
This simple table nicely sums up all of the data that I found.
Overall, this data shows that Habitat homes help communities by generating thousands of dollars in property tax revenue. This provides a strong argument in favor of building Habitat homes in communities, and could be helpful in Hartford Habitat's efforts to expand to more towns surrounding Hartford.
