Exploring the Relationship Between School Type and Per-Student Spending

by Keelyn McNamara

Last updated on December 6, 2022

for Data Visualization for All
with Prof. Jack Dougherty
Trinity College, Hartford CT, USA

Introduction

Is there a relationship between Hartford-region public schools and their student spending?

The Hartford region is home to many different types of public schools. With a large variety for parents and students to choose from, differentiating one school type from another can be difficult. There are traditional public neighborhood schools, magnet schools, charter schools, technical high schools and special needs schools and programs. Even schools within the same type differ. For example, magnet schools are not all the same within the Hartford region, there is great variety within the type. Some are operated by the Capitol Region Education Council (CREC) which has the ability to charge tuition, while others are in the Hartford Public School District (HPS) and do not charge tuition. Because Hartford is an open choice district, students also have the option to attend a handful of other magnet schools located in more suburban areas and districts. These magnet schools were categorized as "Other Magnet" for this data study. Schools were manually grouped into five different types, Neighborhood, CREC Magnet, HPS Magnet, Other Magnet and Charter. While school type is not indicative of education quality, it does factor directly into school funding. Connecticut’s school funding relies on a complex set of 10 different formulas that differ by school type. They have been put into place over the last two decades of tumultuous politics. Only one of these formulas takes into account actual student needs, leaving other types of public schools with a generic standard amount of funding ("How CT Funds Education"). Not all schools in Hartford are the same and neither is their funding. Since these funding formulas differ greatly and have been created over the last several years it raises the question, is there a relationship between school type and per-student spending? As well as how has this per-student spending by type changed over time?

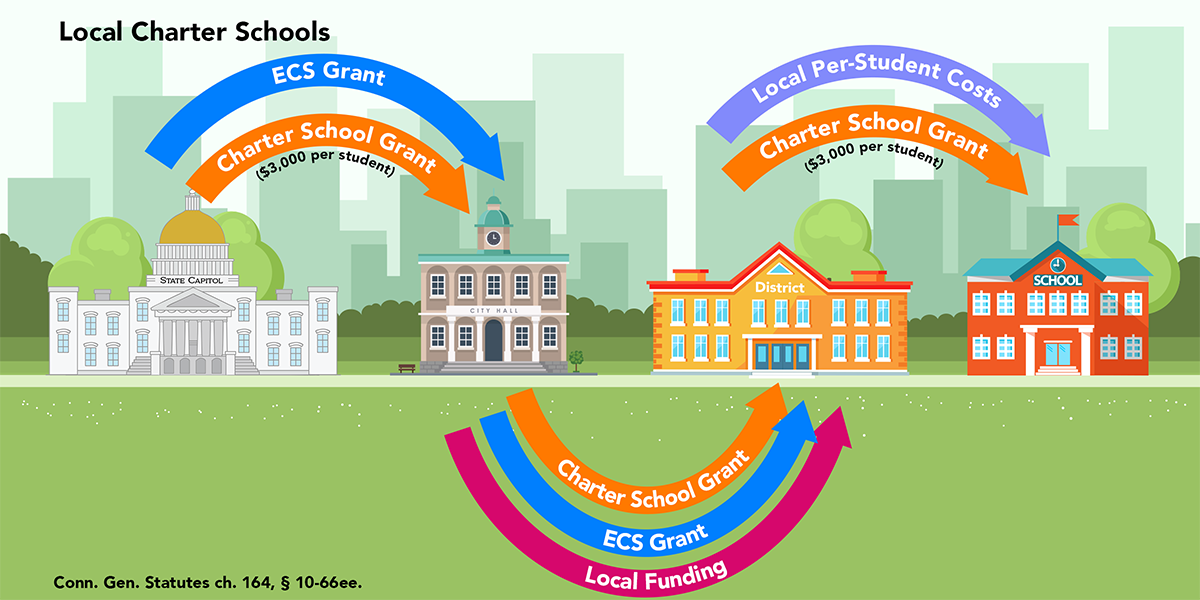
The School and State Finance Project outline the ten different formulas for funding. These formulas are based on type of public school recieving funding.

Image Credit: School and State Finance Project | For full collection of infographics visit the How Connecticut Funds Education web page.

It’s imperative to understand how Hartford public school types have gotten to their current per-student funding before trying to predict or understand where it is going. By tracking what has occurred in per-student funding by school type as well as looking into why, a detailed history can be uncovered. While history does not always dictate the future, it does show how per-student spending has arrived at its current state. Through exploring the history as well as present state of this relationship, previously held assumptions are challenged and surprising differences emerge. The traditional Neighborhood schools are often assumed to be less desirable as they typically are not advertising and recruiting students and families to enroll. While Magnet and Charter schools may be seen as desirable due to their intense marketing campaigns and selective application process. The findings detailed below show a different side to these assumptions. Hartford Neighborhood schools experienced the greatest increase in per-student spending over the past four years. Currently as of the 2021 SYE, Neighborhood schools are spending almost the same amount as the assumed more desirable CREC Magnet schools. Surprisingly, not all magnet schools spend the same amount as CREC schools spent significantly more than the two other types of magnet schools. These findings highlight the many different factors that go into per-student funding as well as how legislature and formulas influence how much a school is able to spend on their students. Furthermore, the findings show how presumptions about school types and spending are not always based on data or truth.

Present State of Student Spending

In School Year End (SYE) 2021, CREC Magnet schools and Hartford Neighborhood schools spent the most per student on average. Figure 1 shows that based on the 20 schools out of the total 43 Neighborhood schools that had data, their spending was only $47 less than the 16 CREC Magnet school spending. This may be surprising due to CREC Magnet schools being presumed as highly desirable. A presumption based on their intensive marketing, school recruitment fairs and application process. Hartford Neighborhood schools are more traditional in the sense that they do not require applications for enrollment nor do they advertise for their school. HPS Magnet schools as well as Other Magnet schools also participate in actively recruiting students to attend their schools but spend less than CREC and neighborhood schools. In Figure 1, it can be seen that the Other and HPS Magnet schools spend $3,600-$3,800 less than CREC Magnet schools. This difference in magnet school funding may be related to CREC’s ability to charge tuition for its schooling. According to the CREC website, “Per Connecticut General Statutes, families of newly enrolled preschool students whose family income is above 75% of the state median income (SMI) will be required to pay a tuition fee.” (“FAQ”). Families below 75% of the state median income do not have to pay tuition. The tuition price is assessed annually (“FAQ”). It is possible this difference in spending between the magnet schools is related to the difference in tuition policies.

Figure 1: Explore the interactive chart | The most recent Hartford-region per-student spending data shows that CREC Magnet Schools and Neighborhood schools have the highest per-student spending for SYE 2021. Charter and HPS Magnet schools have the two lowest amount of per-student spending.

While the magnet schools differ in spending per-student CREC and Neighborhood schools had surprisingly very similar spending despite differing in type. It is possible this is due to the formulas that structure CT school funding. Due to the 1977 CT Supreme Court decision, Horton v. Meskill, which ruled “an education funding system that allows ‘property wealthy’ towns to spend more on education with less effort is a system that impedes children’s constitutional rights to an equal education” the Education Cost Sharing (ECS) formula was created (Haynes). The goal of ECS was to make up for the differences in what it costs to run a public school system and what the town or district could pay (Haynes). Traditional Neighborhood schools are funded by the ECS formula. This gives each school a foundational per-student amount which is what the state has set as the amount to educate a child who does not require additional help. The foundational amount is $11,525 but is revised annually (Haynes). Additional funds are added on to this foundational amount based on varying-levels of student needs. If a student is an English learner and has a low income status then varying amounts of additional funds are added to that per-student amount (Haynes). For example, low income students would receive an additional $3,458 on top of the foundational amount (Haynes). It is interesting to note that Hartford has the highest enrollment of English learner students (Zajec). The majority of these Hartford English learner students are enrolled in the Neighborhood schools (Zajec). It is also important to note that the School and State Finance project reports that Hartford has an average median household income of $36,154, which is the lowest median income in Connecticut (“A Segregated Connecticut”). Because of these findings about the demographics of Hartford and its students it can be speculated that a large number of Hartford students may qualify for those additional learning funds based on need. This need-based ECS formula could be a factor in why Neighborhood school spending was one of the greatest amounts of per-student spending. Neighborhood schools may need a lot more additional funding than HPS Magnet schools, Other Magnet schools or Charter schools because of their students with varying educational needs. There are a multitude of factors that go into per-student spending, it is not simply just on school type.

Past Four Years of Student Spending

These factors change over time as new groups of students enter school systems and policies surrounding these per-student spending formulas change and adapt. Figure 1 only provides a small snapshot of the relationship between per-student spending and type. Figure 2 displays an important overview of the past few years of per-student spending by type. This overview allows us to understand how we got to our current state of per-student spending by type and the changes in spending that have occurred over the past four years. The biggest change in per-student spending over the past four years can be seen in Neighborhood schools. Figure 2 shows a $2,220 increase in spending from SYE 2019 to SYE 2020, then another $2,480 increase from SYE 2020 to SYE 2021. Over just two years Neighborhood school per-student funding increased $4,700. This was the largest increase experienced by any of the schools, as Neighborhood schools went from spending the second least per-student to spending the second most and only $47 behind tuition based CREC schools. This increase is important to take note of as it may have been caused by several different aspects of what makes up the whole image of per-student funding. Figure 2's findings provide the backdrop of how the data in Figure 1 became the current state of spending. By reviewing some of the events that have happened in the last four years speculations can be made about what influenced these changes in per-student spending.

Figure 2: Explore the interactive chart | Over the past four years Neighborhood schools have experienced a drastic increase in average per-student spending. The other four school types have experienced varying amounts of overall increases from their 2019 to their 2021 student spending.

As discussed in Figure 1, the ECS formula was implemented in 1988 but has been continuously revised and edited. Currently Hartford is in a phase-in period to adjust their 2017 ECS amounts to a new larger amount, updated by the 2023 ECS model revision (Haynes). Not all schools were given more funding through the 2023 ECS revision. This phase-in was implemented in 2019 which is also the same year Neighborhood schools began their increase. It is meant to gradually bring towns that are receiving an increase in funding to their full amount of funding in the next 10 years (Haynes). This means that full ECS funding will be received by schools in SYE 2028. This number is also not static according to the School and State Finance Project, “it depends on demographic and town wealth data” (Haynes). This gradual increase in Neighborhood school spending may be related to the ECS formula gradually increasing funding starting in 2019. Not all school types may have experienced an increase or this drastic of an increase as they may not be funded in the same way the ECS funds Neighborhood schools. This may have been why Other Magnet, Charter and HPS schools did not experience such an increase in spending. There are a multitude of factors that contribute to this per-student amount that don’t just rely on school type. A school’s current and past spending formulas, student needs and demographics, enrollment all influence per-student spending and are not kept constant year to year.

Another more modern funding factor is the COVID-19 relief that Connecticut schools received in March 2020 as a part of the Elementary and Secondary School Emergency Relief (ESSER). This emergency funding came in three different relief packages one in March 2020, second in December 2020 and then in March 2021 (“COVID-19 Relief Funding”). According to the School and State Finance Project, “This emergency funding is distributed based on Title 1, Part A, which provides federal funding to school districts with high numbers of students from low-income families” (“COVID-19 Relief Funding”). It could be hypothesized that Hartford Neighborhood schools may have received more ESSER funding due to a higher student need based on demographic and income data. It could be another additional factor in the drastic increase for Neighborhood schools. ESSER funding can be speculated as well to have contributed to the slight increases in other school types as well. Overall, there are many different policies, legislature, demographics and economic factors that have influenced the landscape of per-student spending. Figure 2, shows that each type may be influenced differently by these different factors accounting for very different per-student spending changes and trends for over the last 4 years.

Process and Cautions

These findings were created with data collected from EdSight, Connecticut State Government’s Database for educational data. All schools within the Hartford region were manually grouped by the types that are specified in the Introduction and matched with EdSight data to find each individual school’s per-student spending. EdSight provided the generic types of schools like "magnet" and "charter." For this data story they were then split up even further to fit the specific types of magent. School codes were used for matching Hartford region schools to the data from EdSight. This means that even if a school’s name were written differently or had changed, the data would still be retrieved. Within each type the per-student spending total amounts from each school were summed and averaged. This provided the average per-student spending by type.These are averages and are not always representative of every school’s spending within its type. While Edsight is a reliable source for data collection it is not fully comprehensive. Several schools have special programs within them, for example, “iGOAL 2 - Kennelly School.” These special programs contain a different school code than the school they are associated with. This differentiates them as a separate or different school. Data for these types of schools was not found but data for their associated school was. See Notes for PPE Data for a full comprehensive list of Hartford-region schools that were not included due to insufficient data. These schools mainly fell into the Neighborhood school type which is why in Figure 1 only 20 out of the 44 Neighborhood school codes were surveyed.

Not only were some individual school’s data missing but throughout my data collection, several schools and types of schools were missing. While the findings highlight five types, these are not the only school types Hartford-region students can choose from. There are three technical high schools in the Hartford-region focusing on vocational and technical education. They are a part of the Connecticut Technical Education and Career System (CTECS) which is not included in the Edsight data. As of 2017, these schools have begun to transition away from the Connecticut State Department of Education (Connecticut’s Technical Education). Instead the CTECS is set to become its “executive branch agency” (Connecticut’s Technical Education) in 2023. This is most likely why they are not included in the EdSight database. These technical schools are also not funded in the same way that neighborhood, magnet and charter schools are. They do not receive funding through the ECS formula and instead are “state-operated and funded out of the resources of the State of Connecticut’s General Fund" (Connecticut’s Technical Education). CTECS per-student expenditures are also calculated in a different way than other public schools. Teacher retirement and other additional expenses are included in this student spending figure. With no effective way to extract the pure per-student amount away from the total, technical schools were not considered for this data story.

Special needs schools were also not included in the EdSight data. It is noted in the data that “all amounts include regular and special education” ("Per Pupil Expenditures"). Some of the special needs spending may be wrapped up in the same value as the regular education spending for a particular school. To further support this speculation the School and State Finance project states that, “Connecticut’s local public school districts primarily receive funding for students with disabilities from the ECS grant.” So the Neighborhood school funding may have also accounted for special needs students.

Concluding Thoughts

The findings from Figure 1 and Figure 2 describe the most current landscape in CT public school per-student spending. While the data is grouped by type of school it is not always just the type of school that dictates its per-student spending. The formulas used to calculate school funding differ by type but there are so many other need-based and economic factors that also play into that final per-student spending amount. With that being said it is not solely school type that dictates per-student spending. Neighborhood schools and CREC Magnet schools may spend the most per-student but it can be speculated that it is by differing factors like tuition, ESSER and student need funding. The three magnet school types all differ in their per-student spending even though they are all classified as the same overarching type of magnet. As stated at the beginning of this story, it is not per-student spending that defines the education that a student will receive at that school. It is not an indicator of the quality of the school. This data does not show which school types are better or more desirable. Instead it provides an overview of how CT legislature and formulas have influenced the per-student spending of public school types in Hartford.

Bibliography

“A Segregated Connecticut.” School+State Finance Project, https://schoolstatefinance.org/issues/segregated-connecticut. Accessed 26 Nov. 2022.

Connecticut’s Technical Education and Career System - Policy Briefing. School and State Finance Project, 20 Dec. 2021, https://schoolstatefinance.org/resource-assets/Connecticuts-Technical-Education-and-Career-System.pdf

“COVID-19 Relief Funding for Education.” School+State Finance Project, bit.ly/3V4byCw. Accessed 19 Nov. 2022.

“District & School Spending.” School+State Finance Project, https://schoolstatefinance.org/issues/spending. Accessed 12 Nov. 2022.

“FAQ.” CREC Schools of Excellence, https://www.crecschools.org/for_families/faq. Accessed 26 Nov. 2022.

Haynes, Erika, et al. School Finance 101- How Connecticut Funds Education.

“How Connecticut Funds Education.” School+State Finance Project, https://schoolstatefinance.org/issues/how-ct-funds-education. Accessed 26 Nov. 2022.

Goodwin University. Magnet Schools vs. Charter Schools. https://www.goodwin.edu/magnet-schools/school-choice. Accessed 12 Nov. 2022.

“Open Choice Districts.” CT.Gov - Connecticut’s Official State Website, https://portal.ct.gov/SDE/School-Choice/CT-School-Choice/Open-Choice-Programs. Accessed 12 Nov. 2022.

“Per Pupil Expenditures by Object (District).” CT.Gov, https://public-edsight.ct.gov/Overview/Per-Pupil-Expenditures-by-Function---District/Per-Pupil-Expenditures-by-Object---District. Accessed 13 Nov. 2022.

“Spending & Performance.” School+State Finance Project, https://schoolstatefinance.org/issues/spending-performance. Accessed 12 Nov. 2022.

Zajec, Mia. “Enrollment of English Language Learners by School Type.” Datawrapper, Nov. 2022, https://datawrapper.dwcdn.net/05ASp/1/.