Visualizing the Housing Code Cases in Hartford
Out of the total 26,319 housing code cases, Asylum Hill, Barry Square, Northeast, and West End accounted for just over half the total number of cases with 13,186 or 50%. The remainder of the 13 neighborhoods constitute about 50% or 13,133 cases. Consistent with the earlier data, a targeted approach to reducing the number of housing code cases in the future would be an effective strategy.
Four neighborhoods have more than half of the total housing code cases
Figure 1: Mapping where most of the housing code violations are located
Tabulated data highlighting the number of cases in each neighborhood
| NAME | Number of Cases | Percentage of Cases |
|---|---|---|
| ASYLUM HILL | 4561 | 17% |
| BARRY SQUARE | 3224 | 12% |
| BEHIND THE ROCKS | 1289 | 5% |
| BLUE HILLS | 616 | 2% |
| CLAY-ARSENAL | 1696 | 6% |
| DOWNTOWN | 169 | 1% |
| FROG HOLLOW | 1955 | 7% |
| NORTH MEADOWS | 26 | 0% |
| NORTHEAST | 2899 | 11% |
| PARKVILLE | 1200 | 5% |
| SHELDON-CHARTER OAK | 741 | 3% |
| SOUTH END | 1939 | 7% |
| SOUTH GREEN | 853 | 3% |
| SOUTH MEADOWS | 81 | 0% |
| SOUTH WEST | 277 | 1% |
| UPPER ALBANY | 2291 | 9% |
| WEST END | 2502 | 10% |
| Grand Total | 26319 | 100% |
41% of Housing code cases are still open in Hartford
As of 11/9/2021, out of the total 26,319 housing code cases, 10,860 were still open. That is about 41% of the cases. This is an alarmingly large proportion of cases. 59% or 15,459 cases were closed.
10% of Owners Make Up 57% of Housing Code Cases.
Hartford has an issue with real estate owners committing housing code cases.
Of the 19,798 cases with identifiable landlords (looking at the dataset as of November 16, 2021), 11,335 of them were related to just 10% of owners (the 335 owners with the highest number of cases out of the 3,354 owners identified). This finding suggests that a targeted approach toward the handful of owners can be an effective approach to reduce the amount of housing code cases going forward. The 90th percentile of cases (with the highest percentile being most cases and lowest percentile being least cases) is 11 cases, meaning that any owner with 11 or more cases falls into the top 10% of owners in terms of case count.
It must be noted that a reasonable assumption would be that the owners with the highest number of housing code cases own a relatively proportional amount of real estate in Hartford. While this unproven hypothesis may or may not be true, it is still important to understand that most housing code cases are related to a small minority of entities. For more information, see the build 3 graphs that identify housing code case owners by amount of cases.
A good starting point in fighting housing code cases would be to identify the largest non-LLC owners (which can be found among the top entities in the graph below), since those responsible can be tracked down easier than owners who use an LLC to shield themselves.
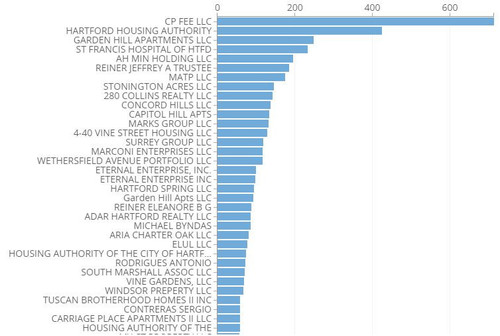
Note: the above image is static. Due to technical errors, the interactive version is temporarily unavailable.